An Environmental Sampling Approach to Product Risk Assessment
The term “risk” can be used in a number of ways. For example, “risk” could mean the public health risk of illness from consumption of a food, or the risk of a product recall, etc. However, “risk” used in this article is defined as the potential for direct, measurable product contamination.
The food industry can ill afford product contamination risk, with an estimated 48 million illnesses, 128,000 hospitalizations and 3,000 deaths per year attributed to food consumption.[1] Furthermore, recalls of food continue to rise (Figure 1), even as most pathogen-associated illnesses that initially declined have leveled off in recent years, as illustrated in Figure 2.[2]

Given all the strides in improving food safety over the past century, we have nevertheless 1.4 million estimated cases of salmonellosis in the United States annually (Figure 3[3]).Great advances in foodborne illness surveillance (e.g., FoodNet and PulseNet) and the advent of the Reportable Food Registry (RFR) have resulted in increased product recalls. This trend is likely to continue as techniques continue to improve. Nevertheless, the U.S. foodborne illness surveillance system is not detecting an average of 3,800 cases of foodborne salmonellosis per day (Figure 3[3]). This may be because fewer cases than previously believed come from food, or that unrecognized food products are contributing to the situation. Such products may include sporadically contaminated “stealth” foods that are added in small volumes to processed foods without a subsequent lethal step. Such products may include, among others, dry (low aw) spices, seasonings, seeds, chopped tree or ground nuts, etc. In fact, the two leading causes of FDA recalls in the period between 2004 and 2011 were nuts, seeds and spices.[4]

The Principal Risk of Ready-to-Eat Processed Food Contamination
The principal source of contamination of ready-to-eat (RTE) foods is environmental contamination within the processing facility.[5] Hence, an understanding of the risk posed by the environment to both low- and high-aw foods is crucial to control such risk, and a risk assessment approach will provide a measurement of the potential for such risk to occur.
In-plant checklist audits are very common in the food industry. However, abundant examples show these have not gotten us to food safety.[6–8] A number of reasons for this exist, including but not necessarily limited to:
• Lack of adequate, dedicated time spent by the auditor observing in-factory conditions.
• Lack of adequate training of the auditors. This does not mean the auditors are inexperienced; rather, their experience may be considerable in one industry but lacking in the industry of which the audited facility is a part.
• Time pressure to accomplish the audit before moving on to the next one.
• Negotiating tactics used by plant management to sway the auditor.
• Auditing for the presence of systems, but not for how well those systems perform.
• Visual in-plant observations that do not capture invisible microbiological conditions.
• Swabs for hygienic indicators not taken by the auditor.
Problems Associated with Sampling-Based Approaches
Unwillingness. Industry can be unwilling to allow microbiological sampling in the plant, due to fear of how the data will be used, potential liability, potential RFR events (real or imagined), etc. The following approaches described in this article have been successfully used, even as a third-party auditor, in a number of facilities.
Interpretive issues. Until now, industry has not had a sampling-based tool to objectively look at in-plant risk of microbial product contamination with Salmonella spp., Listeria monocytogenes and other pathogens from the processing environment.
Foundation for Approaches
Factors affecting environmentally mediated product contamination. Gabis and Faust[9] wrote that the probability of product contamination from the environment depends upon a number of variables, including:
1. Proximity of microbial growth niches to the product stream
2. Number of niches in the factory
3. Spatial relationships of niches and the product stream
4. Microbial population in niches
5. Degree of niche disruption during operations
6. Exposure of the product stream to the environment
Our approach combines this analysis by Gabis and Faust with the work of Tompkin[10], who studied the correlation between floor-associated environmental contamination and product contact surface contamination with L. monocytogenes. Nevertheless, the mechanisms of product contamination with other pathogens will be the same.
Correlations of environmental contamination to product contamination. Tompkin[10] reported on work done in 12 RTE meat production facilities involving approximately 100 packaging lines, across 3 years. According to the article, “each data point…summarizes the results for two months. In the case of packaging lines each data point is based upon 500 composite analyses” (i.e., about 2,500 individual samples at 5 samples per line per composite). The data show a correlation between floor-associated environment Listeria spp. and product contact surface associated Listeria spp. (Figure 4[10]).

In this work, one can see that floor-associated contamination was parallel to that on product contact surfaces. In addition, Thimothe et al.[11] showed a strong correlation (p<0.0001) of environmental contamination and smoked fish product contamination.
Hygienic Indicators
Companies often wish to evaluate their risk potential for contamination and have done so via checklist Good Manufacturing Practices audits and walk-through site-specific risk assessments.[6,7] However, the best approach is to combine these with environmental and product testing. This concept is rejected from fears of government records access and a perception of draconian actions and other fears as mentioned earlier (e.g., Freedom of Information requests from government audits, etc.). However, most food companies routinely test their non-food contact surfaces for pathogens and their food-associated surfaces postcleaning or postsanitation for hygienic indicators. The presence of nonpathogenic hygienic indicators is of little regulatory significance (e.g., should not result in an RFR requirement). Consequently, an approach that relies upon hygienic indicators is one that can (and should) reasonably be used by any food manufacturer concerned about actual microbiological contamination.
Premise of the Approach
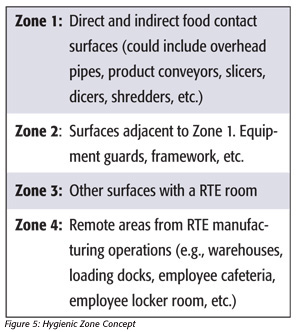
The basic premise of the approach is that a relationsip between microbes in the environment and microbes on product contact surfaces exists and that contamination of product contact surfaces will result in eventual measurable product contamination events. The Tompkin et al. (1992) study revealed that the incidence of product contamination was well below that of the product surface contamination. However, the approach described in this article also recognizes that one may not find the target pathogen or hygienic indicator in the general plant environment, but rather on zone 2 or zone 1 surfaces, as has occurred, albeit less frequently, in the author’s experience.
The zone concept is described below in Figure 5.
Swabbing approaches for use in zones 3 and 4. A sampling-based environmental risk assessment matrix is depicted in Figure 6. The first two columns relate to results from swabbing for pathogens (e.g., Salmonella or Listeria spp. or potentially for Shiga toxin-producing Escherichia coli, or STEC) in zones 3 and 4 of the entire production facility. In the case of a third-party audit, the plant may elect not to swab for the presence of Salmonella, although this is preferred. In this same instance, the matrix can be modified. However, the other hygienic indicator tests should not present a problem in this author’s view. Hence, the grid below can be used without Salmonella testing in zones 3 and 4, if necessary.

In this approach, swabbing of the general environment of the entire plant’s zone 3 and zone 4 areas is performed. Sufficient samples should be collected such that data are relevant. It is recommended that at least 60 samples from zones 3 and 4 combined be taken, although 100 are preferred in most plant environments. In dry-food processing environments, where the concern is potential Salmonella contamination, the hydrogen-sulfide-producing thermoduric Enterobacteriaceae (HTEB) hygienic indicator assay should be performed along with the Enterobacteriaceae (EB) count. In a limited study, the HTEB assay has been shown to detect Citrobacter freundii strains, Escherichia hermanii, Enterobacter amnigenus-2, Morganella morganii, Proteus mirabilis and Salmonella in plant environments.[12]
In high-moisture food production environments, environmental Listeria spp. (not L. monocytogenes) should be tested along with the aerobic plate count (APC), modified Oxford agar (MOX) count or MOX/trypticase soy agar with 0.6 percent yeast extract overlay count[13] and a hygienic quality assay (HQA, described later). However, this author has been involved in situations where the Listeria risk was assessed in low-moisture food production facilities. A Salmonella risk assessment in a high-moisture plant may also need to be done. In environments wherein Cronobacter are of concern, both Cronobacter and EB, and/or coliform, counts should be performed in zones 3 and 4 of the plant. If STECs are a concern, the environment may be tested for coliforms and EB, as well as for STECs.
Zones 1 and 2 sampling. In general, environmental surfaces taken after wet cleaning and sanitation ought to be tested in dry-food production environments.[12] Postoperational sampling is desirable in high-aw food production environments, as the microbiological risk will generally be greater in both these circumstances. The presence of HTEB or MOX (or HQA) positives indicates the presence of microbes of similar physiology to Salmonella or Listeria spp., respectively. The presence of 10 or more coliforms or EB or 1,000 APC per 1 ft2 or HTEB or HQA positives on a zone 1 or 2 surface that has been cleaned and sanitized indicates a sanitation failure, whereas the presence of 100,000 coliforms, EB or APC on a large surface area (e.g., about 1 ft2) indicates the presence of uncontrolled microbial growth.14
HQA results are Listeria-like organisms recovered from Baird-Parker agar after enrichment in a proprietary medium. This assay is not a truncated Listeria assay.
Finished Product or In-Line Tests
The presence of hygienic indicators—for example, 100 or more EB on a dry product that has passed through a lethal step—indicates postprocess contamination. Hence, the presence of Salmonella or 5 percent HTEB on samples taken in the general environment (i.e., zones 3 and 4), the presence of HTEB on zones 1 and 2 surfaces and EB in finished product will result in a substantial risk for Salmonella contamination (see risk level “4” in Figure 6). Similar approaches can be used for Listeria risk or other microbiological contamination potential.
For example, other vegetative microbes found in product after a lethal step would also represent postprocess contamination. For example, we reported[15, 16] that the presence of Listeria spp. on Baird-Parker agar yields black, less-than-3-mm-diameter colonies without a halo. A risk assessment for Listeria spp. may involve testing zones 3 and 4 for Listeria spp., zones 1 and 2 for the presence of Listeria-like organisms and product testing by plating samples onto the surface of trypticase soy agar overlaid onto MOX agar[13] or plating onto Baird-Parker agar.
We have used similar approaches with regard to risk potential for Bacillus cereus, wherein much of the environment (zones 3 and 4) had 100,000 B. cereus per large surface area (e.g., 1 ft2), and the product and product contact surfaces had 100,000 mesophilic aerobic spores. In this case, some modification of the risk assessment matrix was made to account for the potential that product would receive a high B. cereus count (e.g., 100,000 B. cereus or more as the matrix in question was expected to be naturally contaminated with a low level of spores).
Risk Assessment Matrix
(The term “risk” refers to the risk of direct measurable product contamination with organisms, not public health risk, which can vary between organisms, strains, people groups, matrices, quantity consumed, etc. An example of a risk assessment grid appears in Figure 6.)
The concepts described here have led to a five-point risk assessment. Risk levels 1 and 5 are not depicted in the matrix. Risk level 1 is that which may be associated with a product biocidally treated in its end-use container and is the lowest risk level. A well-run canning operation may be assigned a risk level 1. Risk level 5 is associated with a product or zone 1 surface that has tested positive for a pathogen. Hence, the matrix depicts situations in which the plant is typically operating but wants to understand its relative risk for contamination yet cannot afford the operational hurdles associated with testing product contact surfaces for pathogens.
Interpretation of Risk and Exceptions to the Matrix
The relative risk of contamination between categories is likely to be very large, and it may be more appropriate to think about these similar to the way we think of logarithmic differences. Hence, risk level 4 is likely to be much more than twice the risk of risk level 2.
Some judgment may be required with regard to interpretations from the matrix. As noted above, in some cases, the grid may need to be modified or reinterpreted to fit the particular product or manufacturing environment. For example, you may encounter a plant wherein more than 5 percent of samples in zones 3 and 4 have 100,000 or more EB per large (e.g., 1 ft2) surface areas sampled, but no HTEB were recovered. In this case, you may wish to use the HTEB-negative results to guide the risk assessment, unless the plant has a history of rare hydrogen sulfide-negative Salmonella, in which case the EB results in the general environment should trump the HTEB results.
Some facilities may have a very high degree of traffic restriction between production areas. Hence, the presence of HTEB in one area may not be considered as it relates to another area, as it normally would be if the production environments were shared and there were a degree of cross-contamination between production and nonproduction environments.
Summary and Caveats
The semiquantitative risk assessment matrix we developed for use with our clients to assess the potential for selected environmental pathogen contamination of food products does not assess the risk associated with ingredients or chemicals or allergens. There can be situations in which the matrix should be modified depending upon the layout and complexity of the operation. The assay will only be as good as the rigor in which it is applied, particularly as it relates to difficult-to-disassemble zone 2 swab sampling. We have developed a hygienic indicator assay for most Salmonella (e.g., HTEB) and some media-based approaches for L. monocytogenes (e.g., HQA) as well as other pathogens. Others are under development. License agreements for the assays can be requested from Kornacki Microbiology Solutions Inc.
Jeffrey L. Kornacki, Ph.D., is president of Kornacki Microbiology Solutions Inc. in McFarland (Madison), WI. Dr. Kornacki has performed in-factory microbiological investigations, risk assessments and food safety-related audits for 25 years in over 500 food processing facilities in a variety of capacities with different organizations. He has researched, published and spoken widely on pathogen control, testing and sampling in food production facilities. He is a member of the editorial advisory board of Food Safety Magazine.
References
1. Scallan, E., R.M. Hoekstra, F.J. Angulo, R.V. Tauxe, M.A. Widdowson, S.L. Roy, J.L. Jones and P.M. Griffin. 2011. Foodborne illness acquired in the United States – Major pathogens. Emerg Infect Dis 17(1):7–15.
2. www.cdc.gov/foodnet/data/trends/figures-2011.html#fig2.
3. Lynch, M.F. and R.V. Tauxe. 2009. Salmonellosis: Nontyphoidal. Chapter 32 in Evans, A.S. and Brachman, P.S., eds., Bacterial infections of humans. New York: Springer.
4. Beuchat, L.R., E. Komitopoulous, H. Beckers, R.P. Betts, F.O. Bourdischon, S.A. Fanning, H.M. Joosten and B.H. Ter Kuilez. 2013. Low-water-activity foods: Increased concern as vehicles of foodborne pathogens. J Food Prot 76 (1):150–172.
5. Behling, R.G., J. Eifert, M.C. Erickson, J.B. Gurtler, J.L. Kornacki, E. Line, R. Radcliff, E.T. Ryser, B. Stawick and Z. Yan. 2010. Selected pathogens of concern to industrial food processors: Infectious, toxigenic, toxico-infectious, selected emerging pathogenic bacteria. Chapter 2 in Kornacki, J.L., ed., Principles of microbiological troubleshooting in the industrial food processing environment. New York: Springer, 5–61.
6. Kornacki, J.L. 2009. The missing element in microbiological food safety inspection approaches, part 1. Food Safety Magazine 15(1):24–28, 60.
7. Kornacki, J.L. 2009. The missing element in microbiological food safety inspection approaches, part 2. Food Safety Magazine 15(2):18–23.
8. www.bloomberg.com/news/2012-10-11/food-sickens-millions-as-industry-paid-inspectors-find-it-safe.html.
9. Gabis, D.A. and R.E. Faust. 1988. Controlling microbial growth in the food-processing environment. Food Technol Dec:81–82, 89.
10. Tompkin, R.B., L.N. Christiansen, A.B. Shaparis, R.L. Baker and J.M. Schroeder. 1992. Control of Listeria monocytogenes in processed meats. Food Aust 44:370–376.
11. Thimothe, J., K.K. Nightingale, K. Gall, V.N. Scott and M. Wiedmann. 2004. Tracking of Listeria monocytogenes in smoked fish processing plants. J Food Prot 67:328–341.
12. Kornacki, J.L. 2012. Hygiene control in the dry food products industry: The roles of cleaning methods and hygienic indicators. Chapter 28 in Hoorfar, J., ed., Case studies in food safety and authenticity: Lessons from real-life situations. Philadelphia: Woodhead Publishing Ltd., 254–266.
13. Yan, Z., J.B. Gurtler and J.L. Kornacki. 2006. A solid agar overlay method for recovery of heat-injured Listeria monocytogenes. J Food Prot 69(2):428–431.
14. Kornacki, J.L. 2010. How do I sample the environment? Chapter 7 in Kornacki, J.L., ed., Principles of microbiological troubleshooting in the industrial food processing environment. New York: Springer, 125–136.
15. Kornacki, J.L., J.B. Gurtler, Z. Yan and C.M. Cooper. 2003. Evaluation of several modifications of an ecometric technique for assessment of media performance. Abstract T01. International Association for Food Protection Annual Meeting, August 10–13. New Orleans.
16. Kornacki, J.L., J.B. Gurtler, Z. Yan and C.M. Cooper. 2003. Evaluation of several modifications of an ecometric technique for assessment of media performance. J Food Prot 66(9):1727–1732.
p>
Looking for quick answers on food safety topics?
Try Ask FSM, our new smart AI search tool.
Ask FSM →


