Simulation of Sampling Strategies for Food Safety: A New Tool for Improved Sampling Performance
One solution to sampling problems is to maximize the power of sampling plans to detect target hazards at explicitly defined risk levels

Food safety sampling is often in the spotlight when contaminated products cause illness or injury. Consumers question if the product was tested and, if so, why the testing did not detect the pathogen, toxin, or other hazard responsible. The unfortunate reality is that, although many food products are tested for hazards, they test negative, and yet high-profile recalls or outbreaks still occur in those commodities.
Why does this happen? In many bulk products, hazard contamination is not uniformly distributed, and it occurs at low levels when it does occur. Even those clusters of low-level contamination may present a risk of a recall or an outbreak. Yet, such clusters of low-level contamination make it difficult to take what are typically relatively small product grab samples used for testing in a way that would capture the hazard if it were present. This is not a "needle in a haystack" problem—those are easy to solve with a metal detector. Instead, it is a microscopic bacterium on a few produce leaves or a few nanograms of toxin on some corn kernels in a large bin.
One solution to the problem is to use larger sample sizes and many more, ideally randomized, grab sampling points to increase the scope of product represented in the sample1,2 and, therefore, increase the probability of detection. Typically, this research focuses on statistical theory, deriving equations to represent an ideal food system. This approach has some caveats. Large production quantities, uneven distribution of contaminants, and supply chain logistics create challenges for collecting random samples and processing larger sample quantities. Some models also do not account for real-life factors such as skewness and distribution of contamination. Therefore, food safety sampling and testing strategies must seek ways to adapt food safety plans that reflect the reality of contamination to improve hazard detection and, ultimately, help ensure that food is safe for consumers.
Current Sampling Plans and Opportunities for Improvement
Current sampling practices and requirements aim to minimize food safety risk and maximize the rejection of unsafe lots. The U.S. Food and Drug Administration (FDA), the International Commission on Microbiological Specifications for Foods (ICMSF), as well as the Federal Grain Inspection Service (FGIS) have established microbiological criteria and sampling plans to facilitate the detection of hazards in food and improve food safety.3,4,5
For produce, the Leafy Greens STEC Action Plan6 and the publicly available microbiological recommendations by the ICMSF5 outline new microbiological standards and minimum safety standards that help improve food safety. For corn specifically, the FGIS handbooks4 define specific sampling strategies for mycotoxin detection in bulk grain containers. However, these generic sampling plans do not give the food safety professionals who implement them the ability to account for the real-life factors that impact their specific product risk. This lack of flexibility can lead to reduced power of sampling plans, allow recalls or outbreaks, create food waste, and affect brand image.
Introducing a Bulk Sampling Simulation Application
A better solution to this problem is to maximize the power of sampling plans to detect target hazards present at explicitly defined risk levels—e.g., prevalence, level, and/or distribution. This would allow food safety professionals to better manage risk in their specific system. A new, publicly available web app7 offers a platform to virtually create and compare the performance of different sampling scenarios.8 The app has been validated against published data of mycotoxin contamination in corn and pathogen contamination in produce fields. With this app, the user can observe the effects of different sampling plans and compare methods that could improve the probability of detection of hazards, thereby improving the probability of pathogen detection and minimizing the risk of false-negative tests.
For produce, the app provides the user with a tool to analyze different contamination scenarios and different sampling methods for improving pathogen detection. For example, the app allows for comparison of point-source contamination versus area-based contamination, or random sampling against systematic sampling in a produce field.
Looking for quick answers on food safety topics?
Try Ask FSM, our new smart AI search tool.
Ask FSM →
For another bulk product, corn, the app provides the user with a tool to analyze how different levels of mycotoxin contamination, grain container size, number of probes, and other factors affect the detection of mycotoxin in corn. The model parameters are within those established by the U.S. Department of Agriculture for sampling for mycotoxin detection in corn, which includes specifications for probe sampling, sampling strategy in corn containers, and specific assay methods.
Getting Started: Using the App
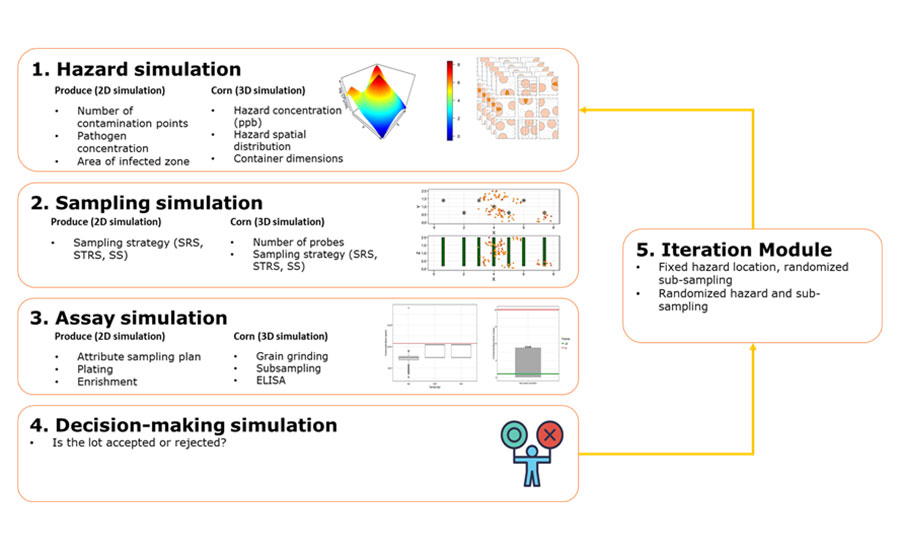
The purpose of the app is to use simulations to evaluate the performance of sampling scenarios in bulk produce and corn. The app works in four major modules to simulate a sampling scenario (Figure 1). The model first simulates the target hazard, including the number of contamination points, the contamination area, and the distribution of hazards in the affected zone. The model will simulate various sampling strategies based on the number of probes and method of sample collection, followed by simulation of sample processing, subsampling, and detection assays. Ultimately, the simulation of a decision on whether to accept or reject the lot will occur. In a few minutes, the entire process is iterated thousands of times to calculate the probability of detection of the hazards according to the intended sampling strategy. Through this method, the app will offer a metric, based on quantitative risk modeling, to measure how reliable the analyzed sampling plan is at detecting mycotoxins or pathogens.
From a practical point of view, the app offers a tool for users to simulate a sampling plan. In the app, the user can input the desired sampling strategy and the expected contamination parameters to recreate a virtual sampling plan and analyze the performance of that sampling plan in detecting pathogens or mycotoxins.
FIGURE 1. Description of Sampling Simulation Used in the App
Applications of Sampling Simulation App
In this way, the app simulates sampling conditions specific to the user's scenario and gives the user a tool to analyze different sampling strategies and select the one that will be the most efficient in hazard detection. By providing inputs that describe the sampling plans, the app can simulate the sampling scenario and calculate the probability of detecting pathogens in produce or mycotoxins in corn. In the app, the user can compare how different hazard contamination profiles affect sampling plans. It can also help the user select the best sampling strategy to increase the probability of detection, as well as how sampling assay affects the sensitivity of the sampling plan. The user can compare different sampling scenarios and analyze which sampling plans work best for a desired produce field or a specific corn transportation container, along with how well those plans can detect the hazards.
Produce Sampling Inputs
The simulation app has two simulation models: a 3D mode for simulating mycotoxin detection in corn and a 2D mode for simulating pathogen detection in a produce field. Depending on the desired commodity that is under analysis, the user should select the appropriate option for the sampling analysis. Table 1 gives a description of all the required inputs for the sampling simulation for produce. Predetermined values and options are shown for inputs that are not commonly measured in industry practices but are required for statistical analysis and sampling simulation.
TABLE 1. List of Inputs Required for Produce Simulation with Corresponding Descriptions
Corn Sampling Inputs
For a corn sampling simulation (3D simulation), the modeling app offers 15 inputs (Table 2). Most of the values for the input parameters can be customized for the intended sampling strategy. Some inputs require interpretation by the user according to sampling records or previous safety documentation. In case the user does not have access to the information required for a specific input, the predetermined values that are set in the modeling application can be used. Table 2 shows predetermined values and options for inputs that are not commonly measured in industry practices but are required for statistical analysis and sampling simulation.
TABLE 2. List of Inputs Required for Corn Sampling Simulation with Corresponding Descriptions
Executing the Simulation (Produce)
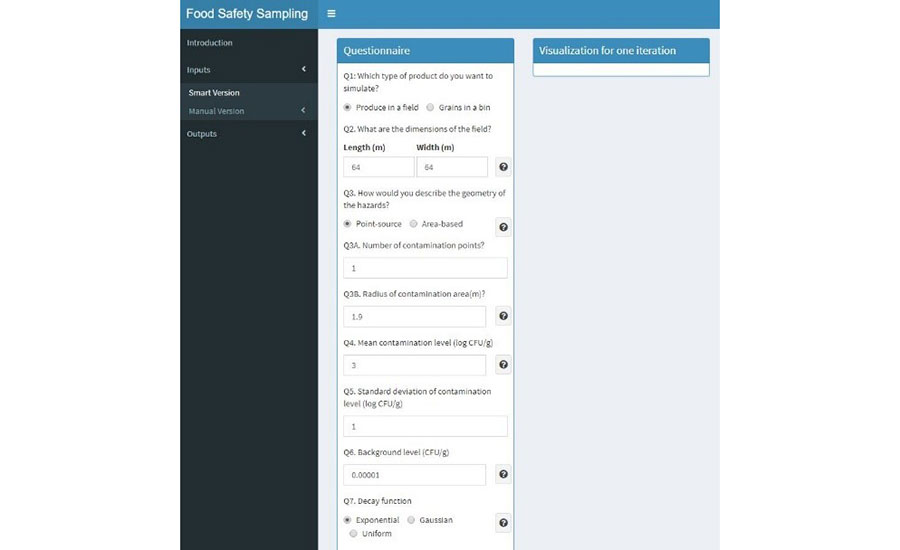
To simulate sampling for pathogen detection in produce, the user must enter the necessary inputs required for 2D simulation. The user must select the option "Inputs" from the left menu and select the "Smart version" option to enter the 2D simulation mode. A questionnaire will show up with the first question asking what type of product will be simulated. For sampling analysis of pathogen detection, the option "Produce in a field" must be selected. Once "Produce in a field" is selected, a questionnaire will expand, and 13 questions will appear for input setup (Figure 2). Here, the user can input the values according to the desired sampling strategy. The user must fill in the questionnaire with all the required inputs that will be used in the sampling strategy. For demonstration purposes, the inputs used for simulation results for produce are shown in Table 3.
FIGURE 2. Visualization of User Interface for Pathogen Sampling Simulation Inputs
Questions 14 and 15 of the application questionnaire are part of the iteration section. To simulate the sampling strategy, the user must input appropriately the values for these two questions to finish the setup for the simulation. The first question for the iteration section is the number of iterations for the simulation. In other words, it is the number of times the model will be simulated to obtain the probability of identification of a pathogen in a produce field (Table 3). For question 14 (Q14), a higher value of iterations (> 100) will allow the modeling application to create and test the sampling strategy further and obtain a robust analysis of the probability of detection. For a rapid analysis of the sampling strategy, the value of 100 can be used as the iteration number. The user can decide for a higher number of iterations for a more robust analysis that could yield a lower error.
The second question requires the user to set up the parameters that will be compared and analyzed, according to the sampling strategy inputs. These parameters are used to visualize and compare the efficacy of the inputs used in the simulated model strategy. For the produce sampling simulation, the modeling app has four parameters that can compare how different metrics affect the sampling strategy and the probability of detection of pathogen contamination in a produce field. These parameters are: the number of contamination points, the number of sampling points, the individual sample mass in grams, and the different sampling strategies.
For question 15, the user has the option to select 0, 1, or 2 for the comparison parameters used in model evaluation. If the user selects the option 0, the model will only iterate the model according to the inputs of the sampling plan from questions 1 to 13. Option 1 and option 2 gives the user the option to compare one or two sets of parameters for sampling scenarios. These give the user the ability to compare how different sampling strategies or levels of contamination (or both) affect the sampling strategy. For the parameters, the user can input different values separated by a comma, according to the parameter selected. Example values are shown in Table 1 for output analysis.
TABLE 3. Description of Inputs Required for Tuning Parameters at the Iteration Section
Results
Once all tuning parameters and inputs are set in the modeling application, the user must load the inputs. To generate results, the user must select the option "Load parameters," located at the end of the questionnaire, and select "Iterate" to generate results. Depending on the inputs of the iteration section, the model may take a couple of minutes to visualize the results.
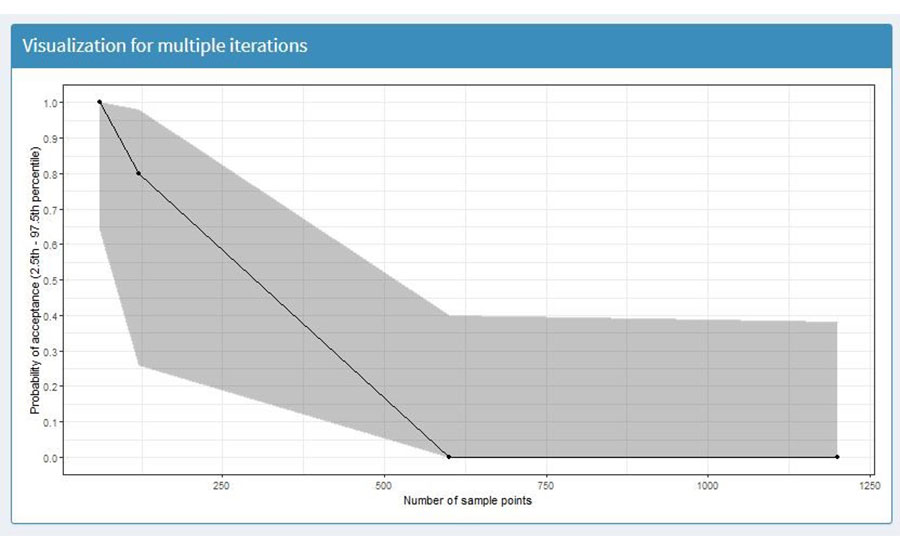
To visualize the results, the user selects the "Outputs" option, located in the left option menu bar, and then "Visualization." For produce sampling simulation, the model will output a linear plot that demonstrates the probability of acceptance of the produce lot (Y-axis) according to the parameters used in the tuning model. For this example, the X-axis shows different levels of mycotoxin contamination (Figure 3). The shaded area is the 95 percent confidence interval of the probability of detection. The X-axis will vary, depending on the parameters used in the tuning parameters section. For the demonstration example, Figure 3 suggests that increasing the number of sampling points across the simulated field will reduce the probability of acceptance of the simulated lot. The output figure can be used to evaluate the performance of the simulated sampling strategy.
FIGURE 3. Probability of Acceptance, According to Simulated Sampling Strategy (Note: This Figure was Generated Using Inputs and Tuning Parameters Shown in Tables 1 and 3, Respectively)
Downloading Results
After outputs visualization, the user is able to download the values behind the visualization results. To download the values of the simulated sampling strategy, the user needs to select the "Output" option, located in the menu bar at the left side of the application, then "Data export," followed by "Download." The application will download a spreadsheet that contains the mean values for the simulated sampling strategy. The spreadsheet will have the mean values for the probability of rejection, as well as the probability of detection of the pathogens, according to the comparison parameters used in the tuning section.
Executing the Simulation (Corn)
To simulate a sampling strategy for mycotoxin detection in corn, the user must enter the necessary inputs required for 3D simulation. The user must select the option "Inputs" from the left menu and select the "Smart version" option to enter the 3D simulation mode. A questionnaire will show up with the first question asking the type of product that will be simulated. For sampling analysis of mycotoxin detection in corn, the option "Grains in a bin" must be selected. Once "Grains in a bin" is selected, the questionnaire will expand, and 15 questions will appear for input setup (Figure 4). Here, the user can input the values, according to the desired sampling strategy.
FIGURE 4. Visualization of User Interface for Mycotoxin Sampling Simulation Inputs
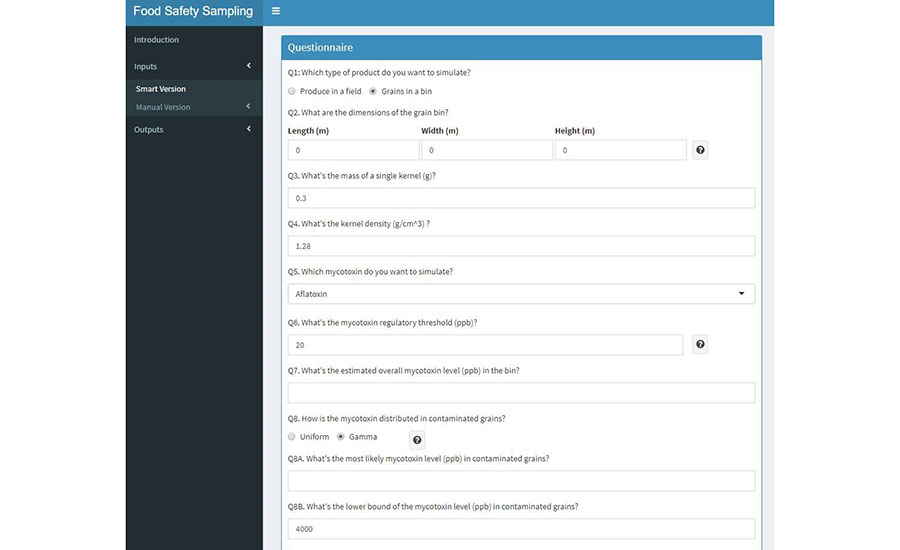
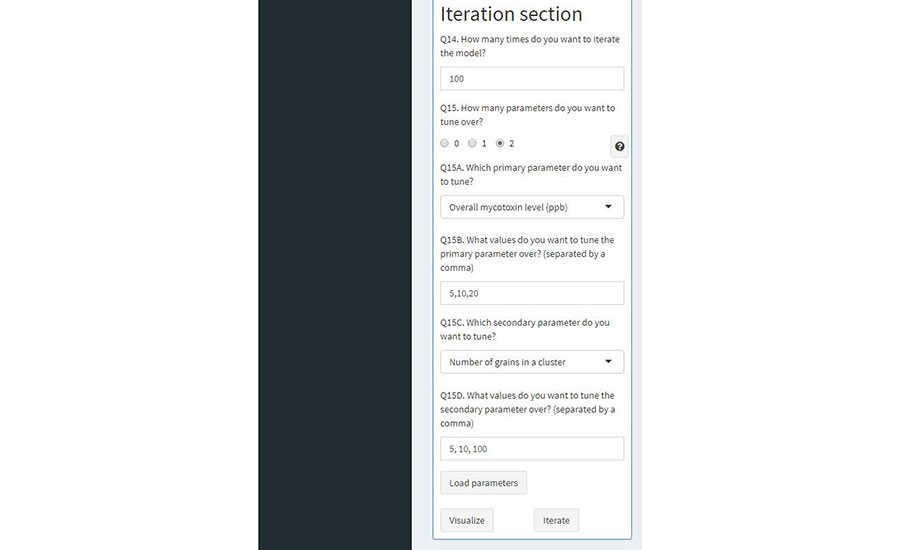
The user must fill in the questionnaire with all the required inputs that will be used in the sampling strategy. Questions 1 to 13 refer to the inputs introduced in the previous section; while questions 14 and 15 are part of the iteration section (See tuning parameters for mycotoxin sampling simulation). For demonstration purposes, the outputs generated in this paper are shown in Table 2. Questions 14 and 15 are the inputs required for the iteration section of the modeling app (Table 4). To simulate the sampling strategy (Figure 5), the user must appropriately input the values for these two questions to finish the setup for the simulation.
TABLE 4. Description of Inputs Required for Tuning Parameters at the Iteration Section
The first question for the iteration section is the number of iterations for the simulation. In other words, it is the number of times the model will be simulated to obtain the probability of mycotoxin detection. For question 14 (Q14), a higher value of iterations (> 100) will allow the modeling application to create and further test the sampling strategy and obtain a robust analysis of the probability of detection. For a rapid analysis of the sampling strategy, the value of 100 can be used as the iteration number. The user can decide for a higher number of iterations for a more robust analysis that could yield a lower error.
The second question requires the user to set up the parameters that will be compared and analyzed, according to the sampling strategy inputs. These parameters are used to visualize and compare the efficacy of the inputs used in the simulated model strategy. For the corn sampling simulation, the modeling app offers three parameters to compare how different metrics affect the sampling strategy and the probability of acceptance of the tested container. These parameters are: the overall mycotoxin level of the container, the number of kernels present in the contaminated cluster, and the sampling strategy.
For question 15, the user has the option to select 0, 1, or 2 for the comparison parameters used in the model evaluation. If the user selects option 0, then the model will only iterate according to the inputs of the sampling plan from questions 1 to 13. Option 1 and option 2 give the user the option to compare 1 or 2 sets of parameters for sampling scenarios. These give the user the ability to compare how different sampling strategies or levels of contamination (or both) affect the sampling strategy. For the parameters, the user can input different values separated by a comma, according to the parameter selected. Example values are shown in Table 2 for output analysis.
FIGURE 5. Visualization of User Interface of Mycotoxin Sampling Simulation Inputs for Modeling Iteration
Results
Once all tuning parameters and inputs are set in the modeling application, the user must load the inputs. To generate the results the user needs, select the option "Load parameters," located at the end of the questionnaire, and select "Iterate" to generate the results. Depending on the inputs of the iteration section, the model could take a couple of minutes to visualize the results.
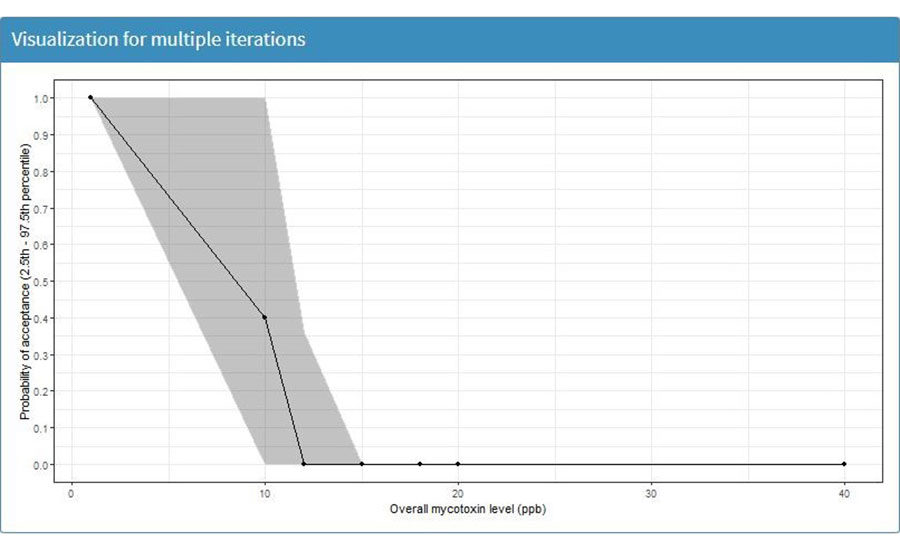
To visualize the results, the user must select the "Outputs" option, located in the left option menu bar, and select "Visualization" (Figure 6). For mycotoxin sampling simulation, the model will output one figure that demonstrates the probability of acceptance of the corn lot (Y-axis) according to the parameters used in the tuning model. For this example, the X-axis shows different levels of mycotoxin contamination (Figure 7). The X-axis will vary, depending on the selected parameters used in the tuning parameters section. For the demonstration example, Figure 7 suggests that increasing mycotoxin contamination with the simulated sampling plan will decrease the probability of acceptance of the simulated corn container. The output figure can be used to evaluate the performance of the simulated sampling strategy.
FIGURE 6. Visualization of User Interface of Mycotoxin Sampling Simulation Outputs for Modeling Iteration
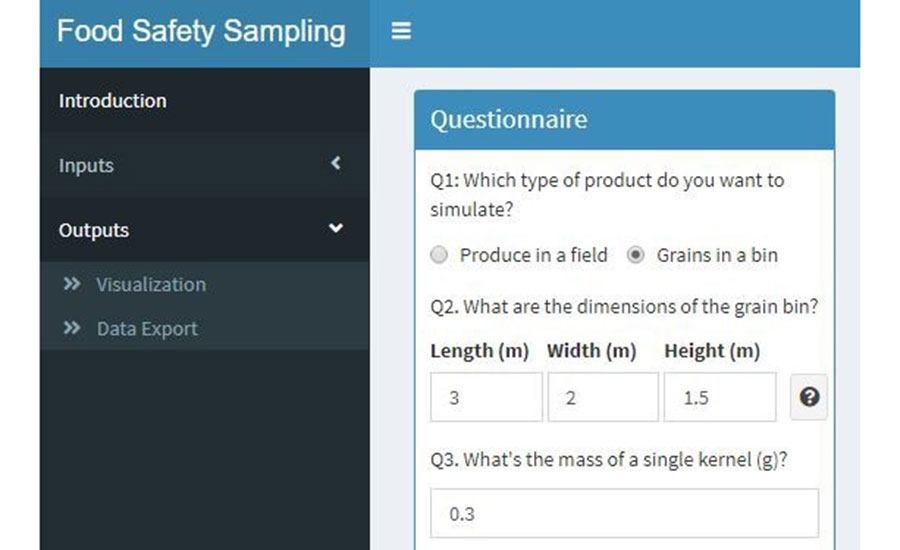
FIGURE 7. Probability of Acceptance, According to Simulated Sampling Strategy (Note: This Figure was Generated Using Inputs and Tuning Parameters Shown in Tables 2 and 4, Respectively).
Downloading Results
After output visualization, the user can download the values behind the visualization results. To download the values of the simulated sampling strategy, the user must select the "Output" option, located in the menu bar at the left side of the application, then "Data export," followed by "Download." The application will download a spreadsheet that contains the mean values for the simulated sampling strategy. The spreadsheet will include the mean values for the probability of rejection, the probability of acceptance, and the parameters used in the tuning section.
Future Work with the New Application
The purpose of this new app is to simulate sampling strategies that are intended to be used in a produce field or a bulk corn container, and to evaluate how powerful those plans are at detecting target hazards. By entering information describing the sampling plan into the app, the model can simulate the proposed scenario and evaluate the plan's effectiveness for accurately accepting or rejecting the produce or corn lot. By changing the inputs in the app, the user can compare various sampling scenarios and determine what kind of sampling plan works best for their specific scenario.
This ready-to-use bulk sampling simulation app will offer a complementary tool to the required protocols established by the U.S. Department of Agriculture (USDA), the U.S. Food and Drug Administration (FDA), and ICMSF. Specifically, it will explore if a modified strategy would work better for the user's product based on the product amount, hazards to control, testing sources, and risk of tolerance. Along with other food safety tools used within the food industry, this app can help improve sampling strategies in leafy greens and corn, or other commodities with similar representation.
Acknowledgements
This work was supported by the Institute for the Advancement of Food and Nutrition Sciences' (IAFNS') Food Microbiology Committee. IAFNS is a nonprofit science organization that pools funding from industry collaborators and advances science through the in-kind and financial contributions from public- and private-sector participants. The authors thank Dr. Brienna Larrick and the IAFNS Food Microbiology Committee members for their critical review of the paper. In addition to this article, a series of videos9 are available that demonstrate the required inputs for bulk sampling simulation in leafy greens and corn, with examples that show users how to use the modeling app.
References
- Bouzembrak, Y. and H. J. van der Fels-Klerx. "Effective sampling strategy to detect food and feed contamination: Herbs and spices case." Food Control 83, Supplement C (2018): 28–37. https://doi.org/10.1016/j.foodcont.2017.04.038.
- Jongenburger, I., H. M. W. den Besten, and M. H. Zwietering. "Statistical aspects of food safety sampling." Annual Review of Food Science and Technology 6, no. 1 (2015): 479–503. https://doi.org/10.1146/annurev-food-022814-015546.
- Andrews, W. H. and T. S. Hammack. FDA Bacteriological Analytical Manual. "Chapter 1: Food Sampling/Preparation of Sample Homogenate." April 2018. https://www.fda.gov/food/laboratory-methods-food/bam-chapter-1-food-samplingpreparation-sample-homogenate.
- Federal Grain Inspection Service. Inspecting Grain: Practical Procedures for Grain Handlers. September 2016. https://www.ams.usda.gov/publications/content/fgis-pdf-handbooks.
- International Commission on Microbiological Specifications for Foods, and Katherine M. J. Swanson. Microorganisms in Foods: Use of Data for Assessing Process Control and Product Acceptance. (Berlin/Heidelberg, Germany: Springer Science, 2011).
- FDA. Center for Food Safety and Applied Nutrition. "Leafy Greens STEC Action Plan." April 6, 2021. https://www.fda.gov/food/foodborne-pathogens/leafy-greens-stec-action-plan.
- "Food Safety Sampling." Stasiewicz Food Safety Lab, Department of Food Science and Human Nutrition, University of Illinois at Urbana-Champaign.Version 4.0. April 8, 2021. https://mstasie.shinyapps.io/ILSI_2D_and_3D_Sampling/.
- Cheng, Xianbin and M. J. Stasiewicz. "Evaluation of the Impact of Skewness, Clustering, and Probe Sampling Plan on Aflatoxin Detection in Corn." Risk Analysis 41, no. 11 (2021): 2065–2080.
- IAFNS. "Simulated Bulk Product Sampling for Food Safety: Video Series." YouTube. April 27, 2022. https://youtube.com/playlist?list=PLoUKOwgymz41-vsPQP5w-t2FjXxFA71Zj.
Ruben A. Chavez, Ph.D., is a Postdoctoral Research Associate in the Department of Food Science and Human Nutrition at the University of Illinois at Urbana-Champaign, where he earned his Ph.D. in Food Science and Human Nutrition. He earned his B.S. degree in Chemistry from the University of Tampa. He is developing a near-infrared-red/visible light/ultraviolet light spectrometer to detect aflatoxin and fumonisin in corn. His research goal is to create a sorting platform with a spectrometer capable of removing mycotoxin-contaminated corn kernels and minimizing food waste while improving food safety and security. He has worked on other research projects that revolve around the analysis of sampling plans for pathogen detection in the food industry, the improvement of pathogen killing procedures in grains, and proper implementation of regulatory compliance in consumer-packaged goods. His areas of expertise are food safety, risk management, and food chemistry.
Matthew Stasiewicz, Ph.D., is an Associate Professor of Applied Food Safety in the Department of Food Science and Human Nutrition at the University of Illinois at Urbana-Champaign. His work focuses on applying engineering and data analytic approaches to advance food safety microbiology. He earned a B.S. degree in Biosystems Engineering and a B.A. degree in Philosophy from Michigan State University. He also studied at Cornell, receiving an M.S. degree and Ph.D. in food microbiology, while working on risk analysis in microbial food safety. His research interests include the identification and management of persistent Listeria monocytogenes in food environments using modern DNA sequencing and improved data analysis techniques. His lab also works with international teams to develop appropriate technology to manage mycotoxins in corn, with his contribution being single-kernel identification and sorting using relatively simple hardware. The lab uses simulation and risk assessment to improve sampling and testing for foodborne pathogens in large-scale food production environments.


