Addressing Misconceptions about Sampling and Testing of Leafy Greens
Manufacturer sampling of leafy greens is characterized by five common misconceptions

With seemingly increasing frequency, we hear about food products causing illness. Attention is invariably focused on the way the products were sampled and tested, often leading to calls for more testing. However, these calls often neglect the importance of sampling in this process. For the balance of this discussion, we will assume that testing is perfect and focus instead on sampling. The food industry recognizes that consumers provide a high level of fitness-for-purpose testing when they use products. Some shrinkage is, of course, involved in this process, but this consumer sampling will always reach beyond what is possible for a manufacturer to achieve. Instead, manufacturers make a more careful study of samples that are expected to be representative of what is delivered to the consumer. The selection of these samples is the focus of this article.
Leafy greens, particularly Romaine lettuce, have been part of the cycle of illness and more sampling. Although that history is not reviewed here, billions have been served and hundreds were potentially sickened. The prevalence of pathogens is low. However, this low level is not acceptable in the marketplace, and the fresh-cut produce industry has and continues to work toward mitigating the pathogen hazards that lead to consumer risk.
This history makes leafy greens a good example for a sampling discussion, including five common misconceptions associated with sampling. However, these principles apply to a wide variety of products where the pathogen levels are low and sampling is used for assessments. Almonds, flour, rice, infant formula, and many other products could also be considered.
For the purpose of this discussion, the author will use fractional colony forming units (CFU) with impunity. Such things do not exist in nature any more than does half a person. (One might have half a corpse, but it is not half a person.) For example, "0.3 CFU per pound" implies that, on average, 3 CFU will be found in 10 pounds. The use of the mathematical construct of a fractional CFU is part of the effort to facilitate comprehension and discuss concepts without unnecessary qualifiers. It would be tedious for the reader if longer explanations were presented throughout the discussion.
For the sake of clarity, contamination level will always be considered as CFU per pound. Others have used percent contamination, but such discussions generally break down when the basis is not clear. For most of this discussion, it is assumed that a sample is a collection of tissue specimens that are composited for testing where the testing is 100 percent accurate—e.g., no false positives or false negatives. An aggregated sample is an exception that is described and discussed below. Mathematically, it is assumed that specimens are independent determinations of contamination even though they are pooled. Given the low contamination rates, this assumption is reasonable.
Misconception 1: Tested Product is Safe
Most food scientists, and almost all food safety practitioners, will object to this statement. Yet, numerous programs exist where leafy greens are sampled and then tested in what is effectively a hold-and-release manner. Very little pushback has emerged against the emotional appeal of this process. Of course, these statements are meant to be provocative. Sampling and testing do have a role in leafy greens food safety programs. However, expectations for these programs must match their capabilities. Unfortunately, sampling and testing programs cannot eliminate pathogen hazards in leafy greens or any other food product.
Looking for quick answers on food safety topics?
Try Ask FSM, our new smart AI search tool.
Ask FSM →
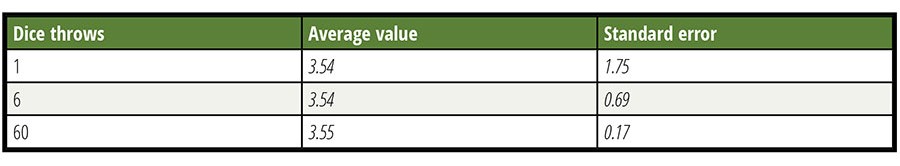
Any sampling plan will inherently have a limit of detection (LOD) even if the testing or measurement tool is perfect. All sampling programs have inherent uncertainty with regard to the sample representing the lot from which the samples were taken. A simple six-sided die can illustrate this situation. See Table 1 where the results of 500 throws taken individually, in groups of six and groups of 60, are compared. The average approaches the theoretical value in all three cases, but the precision of individual determination increases with more observations. After many throws, probability tells us that the average of all throws will be 3.5, a value that can never occur in a single throw. Expecting a close estimate of this result after a few throws is unrealistic. Despite this common knowledge, too many people expect a leafy greens lot sampling to represent a lot with enough fidelity that will enable them to decide whether to accept or reject the lot based on the results. Error is not usually considered.
Table 1. Power of Increased Observations (N)
A sampler may respond that they are collecting 60, 300, or even 600 specimens for testing. The increasing number of specimens will amplify the confidence or reduce the uncertainty in the observation, but it will never prove that no residual hazard exists. Even at 600 specimens of 2.5 g each, the mass being tested is an insignificant portion of the whole. Both the specimens and the total mass are important when considering the power of a sampling program.
The examination of this first misconception concludes with a look at the LOD of a sampling with perfect testing. If a representative random sample of 1,500 g is assumed, irrespective of lot size, then the probability of detection at any average level of contamination can be calculated. This calculation yields an operating curve, as illustrated in Figure 1. Note: the X-axis is a log scale. Movement up or down the curve requires logarithmic changes. It is important to remember that these probabilities reflect the expected result from many samplings and that any individual sampling is still subject to uncertainty. The requirement of a representative random sample eliminates consideration of the special case of an intense contamination event, because some specimen is likely to contain more than 1 CFU. All CFUs must be independent. As shown below, all contamination distributions where a representative random sample of 1,500 g can be achieved (or at least approximated) will follow this operating curve.
Figure 1.Operating Curve for a 1,500-g Sampling
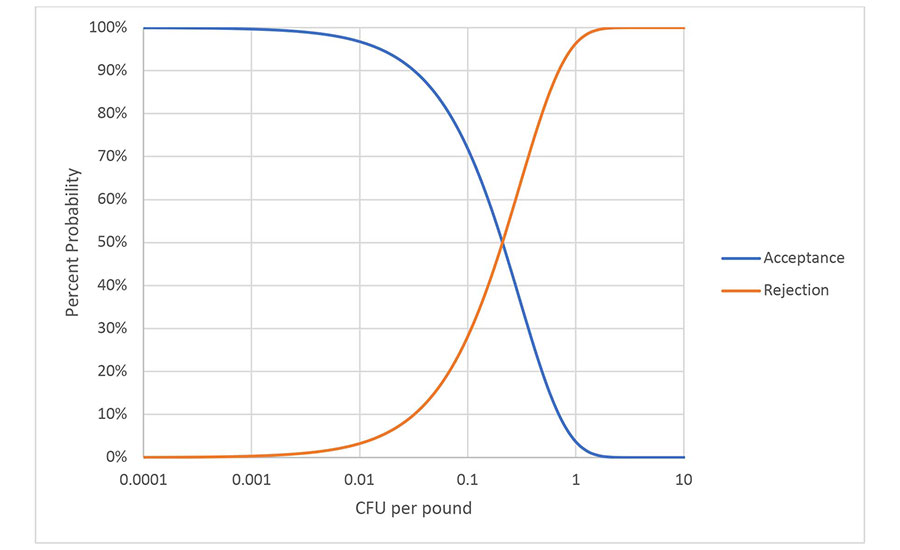
Applying operating curve, the LOD of a sampling program is generally described as the probability of detecting a specific contamination level. For the procedure in Figure 1, the LOD can be described as detecting 1 CFU/pound about 96 percent of the time. Other calculations, such as the familiar most probable number (MPN), can be used to estimate the maximum expected average concentration and the confidence interval for any single sampling and testing event. This calculation requires knowledge of the number of independent determinations that have been made and their size. Confidence intervals and uncertainty will be further discussed later in this article.
The sampling programs used in leafy greens have been largely driven by practicality. Using the concepts discussed here, the LOD and uncertainty can be estimated. Many caveats can be considered. The determination of what is adequate to make a product safe is beyond the scope of this discussion; however, testing cannot eliminate a hazard and, therefore, cannot make a product hazard-free.
Misconception 2: Sampling Small Lots is Better and can Eliminate Clusters
At best, this statement is an oversimplification; at worst, it is wrong. The concept of arbitrarily dividing lots into small sublots for sampling and testing has been largely discredited as too expensive and lacking a feedback loop for continuous improvement. This rejection is also a simplification. Let us examine the three arguments used to support Misconception 2.
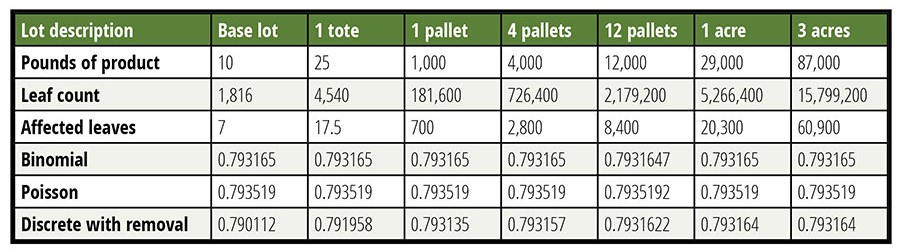
It is argued that by dividing a lot into a smaller sublot, a larger percentage of material can be tested, thereby making the test more sensitive. This is true, but unimportant in this case. Until the sampled percentage of a lot tested reaches approximately 5 percent, the impact of smaller lots is unimportant. This finding is illustrated in Table 2, where the probability of detection is calculated in several manners as a function of lot size with the contamination rate held constant. It is shown that the assumption of a lot that is large relative to the sample is valid over a broad range of lot sizes, which greatly simplifies the calculations. Small lots do not afford a usefully lower LOD.
Table 2 tabulates the probability of acceptance of a false negative for six different-size lots calculated in three different ways. Six decimals are reported to allow the reader to see the very small differences in probability. Unsurprisingly, when the removal of leaves is accounted for, the smallest lot shows the largest change, but this change is only in the third decimal place even when a ten-pound lot is considered. The modeled sample is 150 g, made up of 60 specimens of 2.5 g each (about the weight of a baby spinach leaf). Contamination is held constant at 0.7 CFU per pound.
Table 2. Lot Size is Largely Unimportant
It is also argued that more samples are better. On first impression, this seems self-evident. Unfortunately, in practice, the process amounts to making the same measure multiple times. Each small lot is assessed independently, and the results are not applied in the assessment of other, related small lots. This results in many tests, but there is no added power to mitigate pathogen contamination. If we revisit the discussion of a six-sided die, the problem becomes clear. If 10 dice are thrown six times each and the results are averaged for each die separately, the result will be 10 averages with some level of uncertainty associated with each determination of the average. If the results of all 10 dice are pooled, then a single average will emerge that is much closer to the known ultimate average of 3.5. The uncertainty in this determination will be approximately one third of the uncertainty of the determinations for individual die. As long as the small lots are examined individually, there is no improvement.
If the small lots are examined together, then small lots become a method of stratifying the sampling program, which is an approximation of a random sampling. Sampling many subplots may help a sampling program move toward a representative random sample by ensuring that specimens are widely distributed. Given that this approach will also generally result in more samples, the LOD will be decreased. As a stratified sampling approach, this may be desirable.
The last rationale for the benefits of sampling and testing small sublots involves a conjecture. If contamination is assumed to be clustered such that it concentrates in one of the small lots, it will be easier to detect in that small lot because the local average contamination level will be higher. This is true to the extent that the contamination is concentrated. Under these conditions, it would not be unreasonable to expect a 4–10-fold concentration, making the contamination 4–10-fold easier to detect. Unfortunately, it is unrealistic to expect the contamination to nicely fall within any sublot.
Furthermore, once a positive is found in a sublot, it is unreasonable to assume that all of the contamination has been detected. Therefore, even if the conjecture is true, sublot testing only provides gains to the extent that the sampling rates are increased.
Misconception 3: Clustering Makes a Difference in Sampling
It has been asserted that contamination must be random or homogenous for sampling to be effective. At times, this argument is refined to imply that these constraints apply only to the ability to model the power of a sampling method. In either case, contamination can potentially meet either of these conditions, but these conditions are not necessary for sampling to work or for modeling the power of a sampling plan. It is a necessary and sufficient condition that it is possible to collect a representative random sample. Again, this requirement precludes the case of a highly contaminated point source where the collected specimens of tissue would be expected to contain more than 1 CFU. If known clustering is present, such as for animal intrusion, then sampling can and should be biased to reflect this knowledge to ensure pathogen detection. A priori knowledge completely changes the problem and takes affected lots outside the typical sampling process.
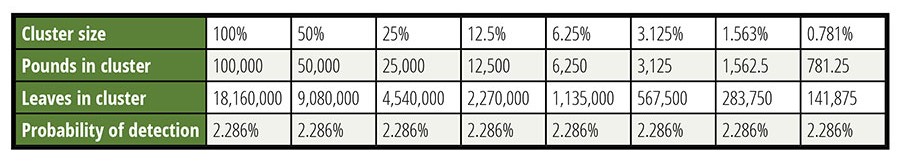
Table 3 considers the detection of various sizes of clusters. The concentration of the CFU into clusters offsets the difficulty of collecting specimens within the cluster. It is important to respect the boundaries associated with these calculations. A cluster that forces more than 1 CFU per specimen is beyond the assumptions made. The use of a Poisson distribution for these calculations also has limitations. The interested reader can search out discussions regarding the approximation of the binomial distribution with the Poisson distribution, but that discussion would interfere with the focus of this article.
In Table 3, an arbitrary lot size of 100,000 pounds was selected to define the limits of concentration. The contamination was set at 0.7 CFU per pound—a very high level associated with causing an outbreak. The sample was 60 specimens of 2.5 grams each, roughly the weight of a leaf of spinach. It should be noted that for the 781.25-pound cluster in the last column, 9 percent of the CFU would share a potential specimen violating the rules of the model for CFU independence.
Table 3. Lot Size is Largely Unimportant
Given the importance of a random sample, it is beneficial to examine the requirements for one. For a sample to be random, all specimens or portions of tissue must have an equal probability of being sampled, and all CFU must have an equal probability of being collected. In practice, this means that no specimens contain more than 1 CFU. In practice, a true random sample is rarely achieved. For leafy greens, various strategies have evolved to generate stratified samples. This means that variables such as bed or furrow are varied with a pattern. This stratification is not random, but it yields samples that can approximate a random sample sufficiently enough to be useful. This stratification also constrains the sampling process in ways that ensure a more representative sampling by guiding the specimen and sample collection.
The number of specimens collected in a sampling program determines the uncertainty in any single determination. This uncertainty is analogous to that observed in an MPN determination. The number of tubes at each dilution are increased to raise the precision of the determination. This strategy is so effective that suppliers have developed special trays to yield 50 or more small wells. As discussed above, the LOD is still driven by the amount of material tested.
For leafy greens sampling, there is another problem that remains to be addressed. A practical way to effectively sample the interior of head lettuce—and Romaine lettuce, in particular—is an impediment to gathering a random sample of these products. The interior of Romaine lettuce is expected to harbor pathogens under some conditions. Head lettuce sampling needs to be improved, and it is an active area of research. This concentration in the interior can be considered a special class of clustering. However, if the interior specimens are sampled, the mathematics still apply. Clustering is only a problem at extremes beyond that which is normally observed.
Misconception 4: Tissue Samples are the Best Way to Assess Pathogen Load
This statement has been generally accepted for a long time. Subsampling food is the traditional approach for microbial risk assessment. Samples are often made of multiple grabs to be more representative. Discussions regarding how to take these samples, the amount of product to collect per sample, and how many grabs to collect, have sought to increase the accuracy and utility of grab-based assessments. Increasing the number and size of samples and increasing the number of grabs per sample provide limited improvement in sample representation. Unfortunately, there are practical limits to the size of samples. Sample sizes are limited by the ability of the laboratory to process them. They are also limited by the increasing risk of interference when enrichment is carried out. For leafy greens, this practical limit is about 375 g. The costs and logistics of taking and analyzing samples makes 10 samples possible, but renders 100 samples impossibly impractical. To achieve a significantly lower LOD requires a logarithmic increase in the number of samples.
A recent development in the meat industry presents an alternative to tissue sampling: aggregated sampling with MicroTally swabs. Aggregated sampling involves sampling the surface of a large percentage of the product, which effectively increases the total sampled weight and effectively increases the number of specimens. In leafy greens, the contamination is largely a surface phenomenon, so aggregated sampling applies. In practice, the knowledge that surface contamination is occurring is a priori knowledge that changes the sampling problem.
At present, the concept of aggregated sampling of leafy greens is moving from concept to practice. Pilot plant and field trials indicate effective sample weights of 1,500 g or more per swab. Analysis of these swabs is simplified by greatly reducing the amount of tissue material that must be processed. The enrichment volumes are also decreased. This is an area to watch—one where best practice may be supplanted by new methods.
Misconception 5: Sampling and Testing is the Best Way to Mitigate Pathogen Hazards
The fresh-cut produce industry has extensively relied on sampling and testing for pathogen control. The absence of a killstep is used as an argument for the status quo. It is asserted that this sampling and testing works because pathogens are detected, but little mention is made of the pathogens that are probably missed. There is a gap between what can be detected for removal by sampling and testing and where a hazard exists for consumers. Sampling and testing is increasingly effective over 0.01 CFU per pound. Others may choose to draw the line lower or higher, but the concept is illustrated in Figure 1. When pathogens loads are lower, illness can still be problematic, especially when large public exposure is considered. Increasing sampling and testing to eliminate illness potential is impractical and, as discussed under Misconception 1, always devolves to an LOD. Other tools are needed, and these tools must be part of an overall safety program with many hurdles.
The industry has made and is making progress to address the gap between testing effectiveness and illness control. To outsiders, these efforts may seem chaotic and disjointed. However, the industry has implemented several organizational solutions, such as the Leafy Greens Marketing Agreement (LGMA) and the Center for Produce Safety (CPS), to bring order from this chaos. These institutions are working to bring improvements throughout the industry. As a researcher, however, the author sometimes feels that progress is too slow.
Mitigation efforts fall into the big category of Good Agricultural Practices (GAP), pre-process testing, processing, and post-process testing. Listing these four categories highlights the dependence on testing. To assess the success of a food safety program without a killstep requires a metric such as Quantitative Risk Assessment. Such tools allow assessment of the incremental improvements. They also help identify redundant measures that seek to solve the same part of the problem. The application of these tools will provide more order and allow decisions about how best to allocate resources. This is a more powerful strategy than simply adding more testing that focuses on the highly contaminated portions of the crop.
The proper use of each tool, including sampling and testing, is critical to reducing risk and protecting the consumer. Science provides the information to make good choices if we listen to the data.
Eric Wilhelmsen, Ph.D., is a recognized world authority in food authentication, serving for over 25 years in both academic and industrial positions. In these roles, he has provided technical leadership and innovation for industrial collaborations. His technical contributions and practical innovations have been fundamental in establishing new revenue streams and profitable businesses in juices, dietary supplements and botanicals, agricultural commodities, byproducts, and beverages. He can be reached at the Alliance of Technical Professionals: eric.wilhelmsen@atpconsultants.com.


