FDA Releases Results of 2019 Food Safety and Nutrition Survey Report
On March 16, the U.S. Food and Drug Administration (FDA) released the results of its 2019 Food Safety and Nutrition Survey Report. This report assesses consumers' awareness, knowledge, understanding, and reported behaviors, relating to different facets of food safety and nutrition-related topics. The results of the survey intend to help FDA make better-informed regulatory, policy, education, and other risk-management decisions, in order to promote and protect public health.
The survey polled adults ages 18 and older in the United States and District of Columbia. A total of 4,398 responses were collected during October through November 2019.
Key findings on food safety included:
- Consumers believe people are more likely to contract a foodborne illness from food prepared at a restaurant, versus food prepared at home. Fifteen percent thought it was "very common" for people to get food poisoning because of the way food is prepared at home, compared to 29 percent who thought it was "very common" to get food poisoning because of the way food is prepared in restaurants.
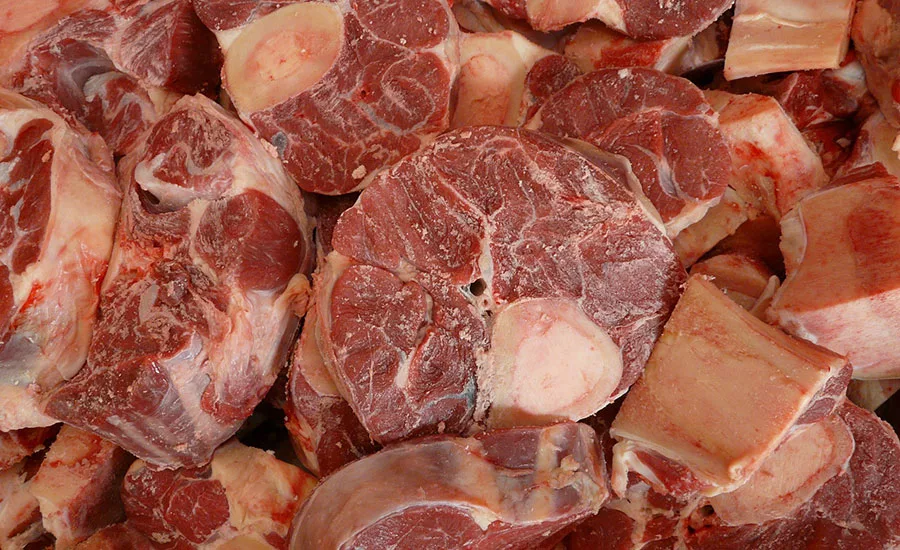
- Consumers are more concerned about raw chicken and raw beef than raw vegetables or fruit being contaminated. More respondents thought that raw chicken (93 percent) and raw beef (66 percent) were “likely or highly likely” to have germs than raw vegetables (9 percent) or fruit (6 percent).
- Consumer awareness of germs varies greatly depending on the type of germ. Awareness is high for Salmonella (97 percent) and Escherichia coli (88 percent), but comparatively low for Campylobacter (7 percent) and Vibrio (4 percent).
- Hand washing practices vary depending on the occasion. Consumers are more likely to wash hands with soap after touching raw meat (76 percent), than before preparing food (68 percent) or after cracking raw eggs (39 percent).
- The majority of consumers own a food thermometer, but usage varies depending on what is being cooked. Sixty-two percent of respondents reported owning a food thermometer. Usage among those who own food thermometers and cook the food ranges from 85 percent for whole chickens, and 79 percent for beef, lamb or pork roasts, to 40 percent for chicken parts, 36 percent for burgers, 23 percent for egg dishes, and 20 percent for frozen meals.
Key findings on nutrition included:
- Most consumers are familiar with the nutrition facts label (NFL). Eighty-seven percent of respondents have looked at the NFL on food packages. The top four items that consumers look for on the label are Calories, Total Sugar, Sodium, and Serving Size. Consumers report using the label most frequently for seeing “how high or low the food is in things like calories, salt, vitamins, or fat,” “for getting a general idea of the nutritional content of the food,” and “to compare different food items with each other.”
- Consumers are familiar with food package claims. Over 80 percent of respondents have seen claims such as “No added sugar,” “Whole grain,” “Organic,” “Gluten-free,” “Low fat,” “No artificial ingredients,” “Low sugar,” and “No artificial colors.”
- Most consumers have seen menu labeling at restaurants. Most respondents (70 percent) reported that they have seen calorie information on menus and menu boards. Of those who have seen such information, 53 percent reported using the calorie information, and most often indicated using it to avoid ordering high-calorie menu items.
Looking for quick answers on food safety topics?
Try Ask FSM, our new smart AI search tool.
Ask FSM →


