A New Era for Food Allergen Analysis? Shifting Focus from Detection to Accurate and Precise Quantification
Method considerations and data gaps must be addressed in the shift toward quantitative, risk-based allergen management strategies
Food allergens are critical food safety hazards for manufacturers, regulators, and allergic consumers. Despite many improvements in recognition of the importance of food allergen management, undeclared food allergens remain the most frequent cause of recalls in the U.S. At the same time, there has been no apparent slowdown in the use of precautionary allergen labeling (PAL), also commonly known as "may contain" labeling. To some extent, both outcomes result from the absence of regulatory thresholds for food allergens, which leads to zero-tolerance approaches to allergen management decisions.
Risk-based approaches for food allergens offer a path forward for both allergen management and PAL decision-making. After many years of research, a clearer picture has emerged of the population-level, threshold-dose distributions for major food allergens using data generated in double-blind, placebo-controlled food challenge studies. In other words, the risk assessment community has a better understanding of the amounts of food allergens that are likely to cause reactions in allergic individuals. Notable initiatives to structure the implementation of risk-based approaches for food allergens include the Voluntary Incidental Trace Allergen Labelling (VITAL) Program from the Allergen Bureau, and ongoing meetings of the ad hoc Food and Agriculture Organization of the United Nations (FAO)/World Health Organization (WHO) Expert Consultation on Risk Assessment of Food Allergens. These efforts have provided clarity on the application of scientific evidence for food allergen risk assessment, which may ultimately lead risk managers and regulatory authorities to develop quantitative action levels for food allergens. If action levels are established, a critical question will be: Can we reliably and accurately quantify food allergens at those action levels?
The current zero-tolerance framework provides minimal impetus for end users to focus on the precision and accuracy of quantitative results. If any detection of undeclared allergen in finished product is considered unacceptable, does it really matter if the relative standard deviation (RSD) of the method is 20 percent, 50 percent, or 100 percent? On the other hand, if action levels are established for food allergens, then both the accuracy and precision of methods become critical performance parameters. The decisions that can be made with a method that demonstrates 10 percent recovery and 50 percent RSD are quite different from decisions based on a method with 80 percent recovery and 15 percent RSD. If the food allergen management field is headed for a shift toward quantitative, risk-based management strategies, then several method considerations and important data gaps must be addressed.
Food Allergen Methods
The most common methods for food allergen analysis are immunoassays, including both quantitative ELISA methods and qualitative lateral flow devices. Immunoassays utilize antibodies that specifically recognize proteins from the food allergen material of interest. In general, immunoassays can have high degrees of both specificity and sensitivity—important characteristics for food allergen methods, which need to be able to detect low concentrations of proteins from one allergenic food in matrices containing a diverse variety of other food components. With respect to quantitative food allergen methods, sandwich ELISA methods are generally the most popular format. Commercial kits for food allergen detection or quantification are manufactured by several companies, and these commercial methods are widely used by food manufacturers and third-party laboratories. However, there are no official or reference methods for food allergens (other than gluten) against which the performance of these many different commercial kits can be compared.
Mass spectrometry (MS) is an emerging methodology for the detection and quantification of food allergens. MS methods for food allergens published to date are bottom-up proteomics methods, meaning that sample proteins are digested into peptides by specific enzymes to enable analysis in the MS instrument. The peptides serve as surrogates for the detection and quantification of proteins from the allergenic food of interest. MS methods can demonstrate similar, or better, specificity and sensitivity performance compared to ELISA methods. In many situations, the fact that MS methods detect specific peptides, rather than relying on antibody binding, is the source of advantages over immunoassays. Specifically, MS methods are not affected by changes to protein conformation that may occur during processing, and rigorous extraction conditions can be used to solubilize protein aggregates inherently present in food matrices or generated during processing. Currently, however, MS methods are not used widely or routinely in food allergen analysis laboratories.
Method Performance Parameters and Limits
Despite the infrequent use of quantitative values, much of the food allergen analysis conducted on ingredients and finished food products has utilized quantitative ELISA methods, as they often have better performance with respect to recovery and specificity in complex matrices than some of their qualitative immunoassay counterparts. As more attention is placed on quantitative information for food allergens, it will be important for method and data users to understand the expected quantitative method performance criteria for these methods, including limit of quantification, recovery, and precision.
FIGURE 1. Limit of Quantification (LOQ) as a Censoring Point
Looking for quick answers on food safety topics?
Try Ask FSM, our new smart AI search tool.
Ask FSM →
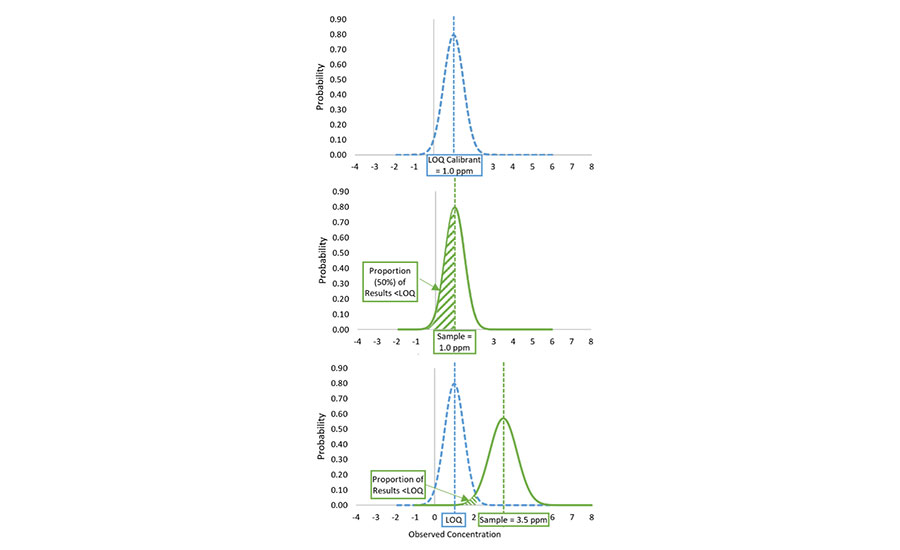
The limit of quantification (LOQ) of a method generally refers to the lowest concentration at which the method provides a quantitative result with an adequate level of precision. Most quantitative, commercial ELISA kits, however, implement a fixed calibration curve and set their stated method LOQ as the lowest non-zero calibrant. Method instructions generally recommend that results less than the LOQ only be reported as below the LOQ. In these instances, the LOQ functions as a censoring point for the method. Under optimal method performance (e.g., 100 percent recovery, uniform precision), a sample with a true concentration that is exactly equivalent to the LOQ calibrant concentration will deliver a result greater than the LOQ 50 percent of the time and a result less than the LOQ 50 percent of the time, as can be seen in Figure 1.
In other words, a sample with a concentration equal to the LOQ will deliver a result of below the LOQ (BLQ) 50 percent of the time. Any time a censoring point is used in a quantitative method, this will be the case. This situation is distinctly different from the use of limits applied to qualitative methods, where the detection limit indicates a concentration at which a result of detection is expected to occur with a given frequency, typically 90–100 percent probability of detection. For quantitative methods, only samples containing analyte concentrations greater than the LOQ would be expected to consistently deliver results greater than the LOQ.
Another critical method performance parameter for quantitative food allergen methods is recovery. Over the past several decades, numerous studies have indicated that many different factors, including matrix composition and food processing, can impact the quantitative recovery of food allergens. For the purposes of method validation, many consider 80–120 percent recovery to be optimal, but 50–150 percent recovery is generally acceptable for food allergen methods given the many complex scenarios involved. For many matrices undergoing extensive thermal processing, however, it is not unusual to observe recovery values far less than 50 percent with current analytical methods. In the case of fermented or hydrolyzed products, very low, if any recovery is observed, particularly with sandwich ELISA methods.
When considering method validation information, it is critical to determine whether reported recovery values were determined from analysis of incurred foods or spiked samples. Incurred foods have food allergen materials incorporated into the matrix formulation prior to any relevant processing used to generate finished product test samples. Spiked samples, on the other hand, have food allergen materials incorporated into a finished food matrix material that has been previously processed. If a method will be used to analyze finished products, information on the quantitative recovery from incurred foods is essential.
FIGURE 2. Relative Standard Deviation (RSD) and Concentration
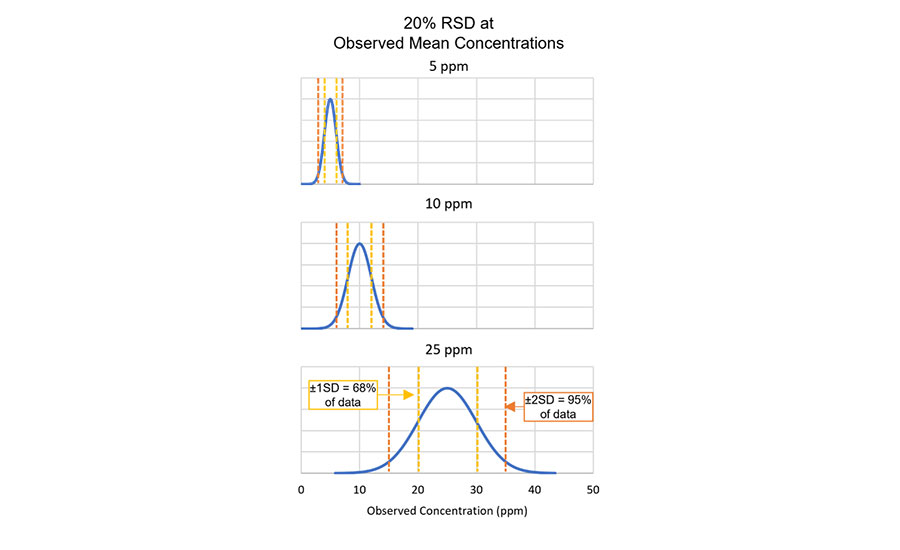
Precision is another parameter essential for evaluating method performance and results. For allergen methods, relative standard deviation (RSD, also referred to as coefficient of variation, CV) is commonly used to describe method precision. RSD is calculated as the observed standard deviation divided by the observed mean. For the same percent RSD values (e.g., 20 percent) at different concentrations, the outcome is larger absolute standard deviations at higher concentrations (Figure 2). It can also be informative to remember that for normally distributed data, 68 percent of data would be expected to fall within the range of the mean ± one standard deviation, while 95 percent of data would be expected to fall within the range of the mean ± two standard deviations. Given the example in Figure 2, for a method demonstrating 20 percent RSD at 25 ppm of analyte, it would not be unexpected to observe results of 15–35 ppm.
Lastly, it is important to recognize that methods have different types of precision that are relevant to end users. Repeatability standard deviation (and corresponding relative standard deviation) should indicate the variation observed when a method is conducted in its entirety under conditions where as many experimental factors as possible are kept constant (e.g., laboratory, day, analyst, equipment, test kit lot, calibration, etc.). Reproducibility standard deviation, on the other hand, indicates the variation observed when the same samples are analyzed in different laboratories. Between repeatability and reproducibility is intermediate precision, where the same samples are analyzed in one laboratory over an extended time period, with changes in the experimental factors mentioned above. Method users should anticipate observing different levels of precision under these different conditions.
Needs and Data Gaps for Quantitative Food Allergen Methods
Among the many needs for food allergen methods to be useful in this new quantitative era, perhaps the most straightforward to tackle is the demand for meaningful, uniform reporting units. Multiple stakeholder groups have recommended that methods report results in mg of total protein from the allergenic source per kg of sample (mg/kg, or ppm, total protein from the allergenic source). These recommendations are based largely on the fact that risk assessment data are analyzed and expressed in terms of the amount of total protein from the allergenic source. Importantly, total protein from the allergenic source is not the same as soluble protein extracted under any given conditions. Total protein from an allergenic source should be measured by a nitrogen determination method capable of analyzing both soluble and insoluble protein fractions (i.e., Kjeldahl or Dumas total protein methods).
For quantitative action levels to be enforceable, there must be methods available to regulatory agencies for accurate and precise quantification. When the action levels are applicable to finished products, the methods must also be fit for purpose for the corresponding processed matrices. A notable example of the potential consequences of a lack of validated quantitative methods is the final rule on gluten-free labeling of fermented or hydrolyzed foods issued by the U.S. Food and Drug Administration (FDA). Since 2013, FDA has implemented a definition for the use of gluten-free labeling that includes a quantitative limit of 20-ppm gluten in finished products. At the time of the rule implementation, commercial methods were available that had been validated for quantification of gluten in several processed food matrices. The validations did not, however, include matrices that had gone through fermentation or hydrolysis processing, and evidence emerged that gluten was not accurately quantified in many of these instances. The FDA subsequently concluded that since no scientifically valid methods were available for quantifying gluten in fermented and hydrolyzed foods, foods and ingredients produced through fermentation and/or hydrolysis must be shown to be gluten-free prior to fermentation/hydrolysis and protected from gluten cross-contact thereafter.
As discussed above, assessment of method accuracy for food allergen quantification in finished products is best conducted using incurred food matrices. Subjecting a matrix with known amounts of food allergen to relevant food processing operations used to produce a finished food product (e.g., baking, frying, fermentation, freezing, drying, acidification, etc.) allows for the most thorough understanding of the accuracy of methods. Many studies have indicated that various types of food processing can alter food allergen protein properties, such as solubility and conformation, which ultimately impact quantitative results. Importantly, these changes in quantitative analytical results do not necessarily indicate changes in clinical allergenicity, or the ability of the food product in question to elicit an allergic response. While it is impossible to prepare incurred foods for every variation in matrix composition and processing conditions, validation studies conducted with a selection of incurred food matrices are the best way to assess the performance of food allergen methods under conditions like those experienced by end users analyzing finished products. Despite this conclusion from prior studies, the performance evaluation of many methods does not included analysis of incurred foods.
An additional gap for quantitative food allergen methods exists in the successful completion of inter-laboratory validation studies. Confidence in the ability of different laboratories to deliver similar quantitative results when analyzing the same samples, using either the same method or different methods, will be essential for the implementation of food allergen action levels. While inter-laboratory studies for some gluten ELISAs have delivered suitable results, the inter-laboratory studies that have been conducted for food allergen methods have generally shown that laboratories may deliver very different results when analyzing the same samples. The few studies that have been done in this area primarily utilized ELISAs, and the availability of data for MS methods is even scarcer. While MS methods have potential advantages over ELISAs, the near absence of inter-laboratory data is a substantial barrier to wider implementation.
The challenges with conducting an inter-laboratory study for food allergens are heightened by another deficiency, the general lack of reference materials, particularly incurred samples, for food allergen analysis. While preparation of incurred foods is not impossible for individual laboratories, it is time-consuming and labor-intensive. Widely accessible incurred food reference materials that are well-characterized, homogeneous, value-assigned, and stable would be ideal, but the level of resources required to generate such reference materials has been a barrier for many years.
Outlook for Food Allergen Quantification
Given the enhanced emphasis on moving toward risk-based approaches for food allergen management, the focus on accurate and precise food allergen quantification can be expected to intensify. Efforts are underway within the analytical community, including through AOAC International, to provide guidance on both food allergen method validation and end-user method implementation and data interpretation. As more quantitative methods attempt to undergo formal method validation studies, some substantial hurdles are anticipated. In finished food products, recovery remains one of the most challenging method performance parameters to adequately meet. Method developers of both ELISA and MS methods will need to continue to focus on this aspect to improve method performance. For food allergen analysis more broadly, reproducibility across laboratories is another issue that deserves more study and improvement. In the meantime, end users of methods and/or data should recognize and account for how method performance characteristics may impact the trueness of the measured values for food allergens.
Melanie Downs, Ph.D., is an Associate Professor affiliated with the Food Allergy Research and Resource Program (FARRP) in the Department of Food Science and Technology at the University of Nebraska–Lincoln. Her research focuses primarily on the proteomics of allergenic foods, including the identification, characterization, and detection of food allergens using mass spectrometry. In addition to research, Dr. Downs also works with the food industry on a number of aspects of food allergen management.


