Lot Acceptance Testing for Ready-to-Eat Salads
Quality assurance (QA) managers routinely have product and raw materials tested for undesirable bacteria. As long as the results are negative, it is easy to feel that all is right with the world and that the operation’s quality and safety systems are functioning correctly. In the ready-to-eat (RTE) salad marketplace, some customers are demanding microbiological testing as part of lot acceptance. These demands for testing are probably driven by past outbreaks and recalls. This testing comes in three basic flavors: raw material testing in the field, raw material testing at receiving and finished product testing. This article examines the deliverables of a typical acceptance program of each flavor, the attributes of a risk-based acceptance testing program and ultimately how to incorporate acceptance testing into a risk-based safety program.
Discussions of acceptance testing can easily be complicated by focusing on the details and exactness of calculations. To partially avoid this pitfall, a simple case study has been included to assist the interested reader through the math as applied to a single lot. This article will call on this example to illustrate important points of discussion. Additionally, as noted in the discussion, other choices will be made without exploring all the alternatives in the interests of brevity. These choices do not change the conclusions of this article.
Analysis of Testing
An analytical testing protocol is fundamental to any acceptance testing program, including those for examining the microbiological safety of RTE salad. In reality, no microbiological test procedure is perfect. There are always some false positives and false negatives in presence-versus-absence testing typically used in acceptance testing. To simplify this discussion, we will assume that both these error rates are negligible. The result of any microbiological test, be it presence or absence or an enumeration, is always associated with a volume or mass of sample. This yields a detection limit for the procedure that is extremely important in an acceptance testing program. The detection of the microorganisms is generally based on antibodies, PCR markers or growth on or in some type of selective media. A few exceptions are in the marketplace, including a phage-based procedure. However, the type of detection is not the focus of this discussion. For this article, we will assume that a hypothetical analytical procedure performs flawlessly with up to a 300-g sample of RTE salad or salad ingredients. A 300-g sample is large for a laboratory to handle on a routine basis. This large sample size provides the maximum practical sensitivity. Furthermore, we will assume that this hypothetical method will detect as little as a single colony-forming unit (CFU) of any pathogen of interest in the tested sample. The detection limit of this ideal method is therefore 1 CFU per 300 g of sample. Multiple samples are required in aggregate to detect levels below this detection limit.
Field Testing
With this idealized microbiological method in hand, we can consider field testing acceptance programs. The performance of a field testing acceptance program will depend on the number and size of the samples taken. Although somewhat counterintuitive, field size, distribution of samples and distribution of contamination are not factors involved in the performance calculations. The size of the field is of minor significance because the total mass of the samples is insignificant when compared with the amount of product in the field. This simplification is the infinite lot approximation, which is generally acceptable until the total amount of sample reaches between 5 and 10 percent of the lot. This is analogous to assuming that cards are returned to the deck when calculating the odds for various hands at poker. In the case of field testing, it is an easily justifiable convenience to ignore field size.
The specific distribution of the samples taken and the specific distribution of the contamination in a field will impact the validity of a specific acceptance or rejection decision, but the laws of large numbers and probability will win out, negating these impacts in aggregate. One can easily imagine specific combinations of samples and distributions of contamination in which the acceptance program will mistakenly accept or reject a field. With foreknowledge, one could easily take corrective action and ensure the proper disposition of the field. In the real world, we lack this knowledge and can therefore do no better than a random sample. This applies even when the contamination is clustered. Deviations from randomness will impact individual decisions but will not affect the probabilities that ultimately dictate the performance of an acceptance program. The average performance of the acceptance program is driven by probability, which we can calculate on the basis of the number of samples and their size. This is why the 100-mL samples in the fanciful example found nothing, but the more extensive one bottle per case found many affected bottles. The bottler’s testing program lacked the sensitivity to observe what was determined to be an unacceptable consumer risk. Negative results do not necessarily demonstrate safety.
As an example of a specific acceptance testing program for accepting or rejecting fields, we will assume that ten 300-gram samples are collected from every field and that these samples are randomly collected with plenty of grabs or specimens, as there is no better approach without additional knowledge. Unfortunately, these numerous grabs only make the samples more representative of the lot and do not increase the sensitivity of the inspection. This is an expensive program and exceeds what is normally found in the marketplace. One can calculate the operating curve (OC) for this inspection with a zero tolerance for pathogens as illustrated in Figure 1 by the curve for n = 10. From this graph, we see that low concentrations of organisms, less than 0.0002 CFUs per serving, are essentially never detected. Fortunately, as will be discussed later, there is little concern below 0.001 CFUs per serving. High concentrations, over 0.2 CFUs per serving, are essentially always detected. At this level, as will be discussed below, about 1 in 5,000 consumers will get sick. For comparing OCs, a typical point of comparison is 95 percent detection, 0.15 CFUs per serving, where 95 percent of lots at this level will be rejected. Conversely, 5 percent of lots at this level of contamination will be accepted. This graph can be moved to the left to detect lower levels of contamination by exponentially increasing the number of samples collected, as seen by the curve for n = 100 in Figure 1. The horizontal axis is log scale, muting the impact of modest increases in sample number. We will consider whether this program is sensitive enough to meet an acceptable level of risk when we consider a risk-based acceptance program later in this article.
Testing at Receiving
The second flavor of acceptance testing is testing at receiving. Under this type of program, the processor defines a lot as a collection of totes or pallets at receiving. This is an arbitrary designation that merits closer scrutiny of its actual validity, but such scrutiny is beyond the scope of this article. As an example, we will assume that product is received in 2,000-pound lots that are sampled for one 300-g sample that is randomly selected as multiple specimens from the entire 2,000 pounds. Again, these specimens do not affect the sensitivity but only potentially make the sample more representative of the specific 2,000 pounds. We can again generate an OC for this acceptance testing program with a zero tolerance, assuming an infinite lot as illustrated in Figure 1 by the curve for n = 1. Note that a 95 percent detection level is 1.5 CFUs per serving or 10× higher than the field program we just considered. This difference is driven entirely by the number of samples used to make the decision. This acceptance program is less sensitive than the field testing program because only one 300-g sample is used to make each acceptance or rejection decision in spite of the smaller designated lot size.
Finished Product Testing
The final flavor of acceptance testing is based on finished product testing. There are many strategies for collecting specimens and compositing them into samples. None of these choices will impact the sensitivity of the program. They will impact the accuracy of individual determination like the grabs and specimens in the two other flavors we have examined. These programs typically sample less than 300 g of material for a decision. Thus, the assumption of an OC of n = 1 from Figure 1 will overestimate the sensitivity of a typical finished product acceptance program, making the typical finished product program the least sensitive of the three flavors. Having examined all three flavors of programs, we can examine the characteristics of a risk-based program and make some comparisons.
Target Tolerance
The most important requirement for a risk-based lot acceptance testing program is a target tolerance. Unfortunately, discussion of a tolerance for pathogens in a product is as awkward as discussing insect parts in peanut butter. Bad stuff is not supposed to be in food, but it is. It is important to remember that such a discussion will have no impact on the fact that pathogens are present on products in the marketplace despite all the testing being done. Inspection programs leak. Processes are not perfect. The goal of a lot acceptance program for RTE salads must be to ensure that these rare pathogens are at vanishingly low concentrations that have no importance. Zero is not achievable.
A number of metrics can be used to design or select a target tolerance to ensure that any remaining pathogens have no importance. For this article, we will use consumer risk of illness. The regulatory zero tolerance for pathogens is not useful for this purpose because no inspection can guarantee zero pathogens. In the case study, a consumer risk of illness of 0.42% was considered unacceptable for the antiaging water. One can postulate that a consumer is willing to accept up to a 1 in 1 million chance of getting ill from eating a serving, 150 g, of RTE salad. There is a tacit assumption that the risk of illness is the limiting safety constraint. This 1 in 1 million rate is an arbitrary choice that feels good. There are arguments to move the value up or down that will be ignored here. Without getting too tied up in the math, one can accept a simple exponential dose-response model [one cell can initiate infection (no threshold); organisms are randomly distributed in the serving; and host-pathogen interaction is a constant] where 1 CFU in a serving has a 0.001 probability of causing an illness. Researchers often advocate more complex models for a dose response, but these models would only add unwarranted complexity to this discussion and would not materially change the conclusions. With these constraints, one can calculate a tolerance of 0.001 CFUs per serving. Figure 2 illustrates the log-to-log relationship between risk and dose expressed as CFUs per serving. Outbreak risk has been previously used as a metric for defining importance and yields similar numbers.[1]

This 0.001 CFU per serving tolerance is the maximum level that a consumer is postulated to willingly accept. Most of the RTE salad must be less than this tolerance or there would be no product to accept with the risk-based acceptance testing process that is being designed. In fact, depending on the specific product, the efficacy of the grower’s Good Agricultural Practices (GAPs) program and ability to control cross-contamination in the processing plants, the background rate should be about 1 percent or less of this tolerance level. All acceptance testing programs leak. This is partly why zero risk can never be achieved. For an acceptance testing program, this leakage rate is usually set at 95 percent rejection of lots at the tolerance. Conversely, this means that 5 percent of the lots at the tolerance level will be accepted. Obviously, lots with a greater level of pathogens would be rejected more completely and those with less will be rejected less completely, as illustrated by the OC in Figure 1. This 95 percent rejection rate will be used to generate the operating curve for the acceptance process using the idealized analytical procedure described above.
Taking the 0.001 CFUs per serving tolerance, the 95 percent rejection rate and the perfect analytical procedure and applying the Poisson approximation of the binomial equation for an infinite lot, one can readily calculate that about 1,500 samples at 300 g each (almost 1,000 pounds) are required for the acceptance sampling program with no positives. The OC for this inspection protocol is illustrated in Figure 3 along with the three previous OCs. It should be noted that this new OC is substantially to the left of the previous three as would be expected with more than 10× more samples. There will of course be arguments that 1,500 samples, or about 1,000 pounds of testing, is unrealistic. However, this number is driven by the selected tolerance.

In the simple case study, the bottler elected to do 100 tests. He found nothing, which is not surprising. Here, too, one can do fewer samples, but fewer samples will not achieve the desired tolerance on a lot-release basis. The impact of too few samples is readily illustrated using colored beads from an urn as a model, as shown in Figure 4. This graph shows that when too few samples are drawn, one gets many cases where no colored beads are drawn and would therefore believe that all the beads are white. When a colored bead is drawn, one believes that there are more colored beads present in the lot. As the number of beads drawn increases for each test, it becomes increasingly possible to estimate the actual percentage of colored beads in the population with a test. Even with few beads per test, the average of many trials will actually correctly determine the percentage of colored beads, because the rules of large numbers and probability will always hold. If one applies these observations to the RTE business, it explains the occasional positives that cannot generally be confirmed and the mostly negative results. The numbers of samples in the three flavors of acceptance programs discussed above are inadequate for acceptance testing against this 0.001 CFU per serving tolerance.

Assuming that one is willing to test the 1,000 or so pounds necessary, one must consider how to make the sample representative. A more representative sample will ensure that the testing yields a more accurate result regarding a specific lot. Again, though, the rules of large numbers and probability will always hold. On average, lots at the tolerance will be detected 95 percent of the time in spite of the sampling protocol. Without prior knowledge, the best sample will be a random sample. Without prior knowledge, dividing the samples into more pieces or specimens is better as it is more tolerant of clustering or layering, which might be present in a specific lot. It should be noted that 1,000 pounds of product will much better represent a field than ten 300-g samples (about 7 pounds), which is at the high end of testing programs for field testing.
To achieve the desired level of consumer risk (1 in 1 million chance of illness) just by testing is not practical. None of the current flavors of acceptance testing are even close to this tolerance. These types of arguments have forced manufacturers in most segments of the food industry away from lot acceptance programs in favor of process control. The cost of monitoring all production this intensely to ensure safety is prohibitive. Furthermore, the result of this intense testing is only a decision to accept or reject a lot as meeting or not meeting a tolerance. In the fanciful case study, after all the testing, the only reasonable decision is to not sell the 100,000 cases. Repeatedly making this same type of decision for RTE salads is not a path to success. At best, it will only postpone an outbreak of consumer illness.
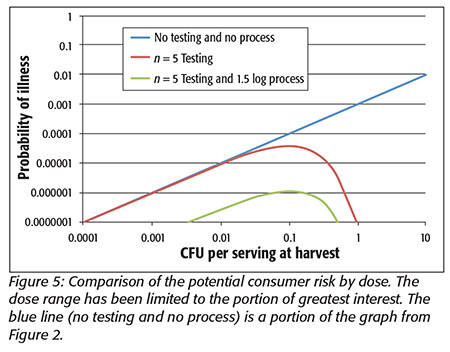
At this point, it is hoped that the reader sees the many parallels between the simple case study and the RTE salad problem. As for the water, an approach that extends beyond testing is required. An approach involving a characterized process and testing to ensure that the raw product does not exceed the process capabilities is required. The process for RTE salads will be less robust than for water (unless one is concerned with preserving its antiaging properties) given the sensitivity of the RTE materials to potential processes. The RTE salad process must at a minimum avoid cross-contamination. If an RTE salad process could consistently deliver over 1.5 logs of lethality for all the organisms of interest, the risk of illness would be tremendously reduced to less than the 1 in 1 million tolerance we have been discussing, as shown in Figure 5. A more potent process will allow further reductions in potential consumer risk. This figure illustrates the impact of a reliable process on reducing the potential consumer risk with a practical testing program to ensure that raw material does not exceed a tolerance beyond the process capabilities. The RTE salad process must address the potentially present lower concentrations of pathogens where testing has no impact, yet the potential pathogens cannot be ignored. The combination of a realistic testing program and a robust process can greatly diminish potential consumer risk of illness.
It is important to note that this combined strategy does not rely on any knowledge of the frequency distribution of pathogens in RTE materials. It simply examines the whole range that could be present. This frequency distribution is not known and is unlikely to be known given the limited sensitivity of testing and monitoring methods. The best data indicate that the average incidence is very low. This proposed strategy relies on the successes of the current GAPs programs but includes a modest amount of testing to verify that the GAPs continue to function as expected and prevent the process from being overwhelmed. This type of approach may prove very useful as RTE processors seek to comply with the Food Safety Modernization Act by bounding the potential risk to consumers. Every processor of RTE product needs to understand the capabilities of its process.
Eric Wilhelmsen, Ph.D., is an Institute of Food Technologist-certified food scientist, serving for over 30 years in both academic and industrial positions. In these roles, he has provided technical leadership and innovation for industrial collaborations. His technical contributions and practical innovations have been fundamental in establishing new revenue streams and profitable businesses in a variety of food categories. His most recent research has focused on defining and closing the testing gap and on developing validated processes to ensure the safety of RTE produce. He can be reached at the Alliance of Technical Professionals: eric.wilhelmsen@atpconsultants.com.
Reference
1. Wilhelmsen, E. 2013. Leafy green processing for ready-to-eat salads. Food Safety Magazine August/September. >
Looking for quick answers on food safety topics?
Try Ask FSM, our new smart AI search tool.
Ask FSM →


