An Integrated Approach to Food Quality and Safety: A Case Study in the Cookie Industry
Quality in the food manufacturing industry can be defined in different ways. One definition of quality is meeting or exceeding customer expectations and requirements.[1] This aspect of quality certainly applies to the food industry as customers expect nutrition, good taste and pleasing appearance in the products they purchase. Another definition of quality that is appli-cable to the food industry is the assurance that the product is safe to eat and that the food is sanitary and has a maintained integrity that is without physical or chemical contamination.[2] Many consumers expect pleasing appearance and taste, and that the food is safe to eat. There are two parameters that can be used to address quality within the food industry. The first is Failure Mode and Effects Analysis (FMEA), which is widely used within multiple industries to improve and manage overall quality. The second is more commonly used for the food safety aspects of quality, Hazard Analysis and Critical Control Points (HACCP), which identifies potential safety risks in food products and proactively seeks to reduce or eliminate them. When integrated, these powerful tools can improve both quality performance and conformance within the food industry.
HACCP originated with the Pillsbury Company when they were asked to supply food for the space program in 1959. They developed a non-testing approach to food safety to ensure the safety of foods that the astronauts would take with them on spaceflights. It was introduced to the U.S. food industry in 1971 at the National Conference on Food Protection.[3] Since then, the HACCP program has grown to be a staple food protection program in the United States and internationally. It is a mandatory program for all U.S. meat, egg and fruit juice producers. The U.S. Food and Drug Administration (FDA) and the U.S. Department of Agriculture (USDA) also encourage it for other food producers in the U.S.[4]
Utilizing These Tools
HACCP begins with defining the food you are producing and its intended use by the consumer. A flowchart is then developed to show all activities that are involved with the product, from raw ingredients to the preparation of the product by the end consumer. A generic flowchart for a frozen raw cookie dough producer is shown in Figure 1.
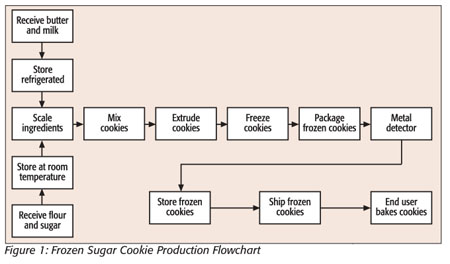
To foodservice employees, the flowchart serves as a visual outline to identify all of the steps in the production process and shows the movement of the product through production. The next step in the HACCP system is to identify any hazards that may be associated with the product. These hazards may be biological (e.g., bacteria), physical (e.g., glass or metal) or chemical (e.g., pesticides or machine grease). In our example, this would be that this particular cookie product contains eggs and milk that constitute a risk of bacteria growth and, thus, a biological hazard if not handled correctly. The chance of metal or grease being introduced into the product within production is an example of a physical hazard. Once hazards associated with the product have been identified, a table can be used to assess the likelihood of each hazard occurring and its level of harm to the consumer. An abbreviated table of hypothetical hazards and possible harm to consumers is presented in Table 1.
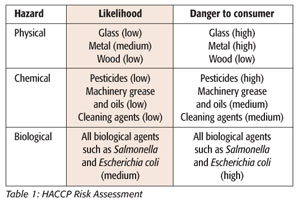
A risk assessment table provides a good model of the most important hazards that must be addressed in the HACCP plan. Those hazards that pose a medium or high possibility of occurring, as well as a medium or high level of possible harm to the consumer, are the hazards that should be deemed critical to the safety of your product. In this case, the most critical hazards would be the physical contamination from metal pieces and biological growth in the product or ingredients that can cause illness.
After the most critical-to-safety hazards have been identified, steps can be taken to reduce or eliminate the possibility of them in the frozen cookies. This is accomplished through the identification of the most likely point that a hazard could be introduced, or a point where a hazard could be detected and eliminated. These points are called Critical Control Points (CCPs).[5] The CCPs for this process are refrigeration and prompt use of those ingredients that may be prone to microbial growth, and the detection and elimination of any cookies that may contain metal pieces using metal detection machinery.
Once the limits for these CCPs are set, a monitoring and recording program can be implemented, and the HACCP plan begins to protect consumers from these dangerous hazards. We now have a quality program in place that deals with the quality the consumer expects with regard to food safety: that the cookies are safe to eat. With a HACCP plan in place, FMEA can be implemented to achieve the nutrition, good taste and visual appeal that constitute other aspects of cookie quality.
When not prodded, the food industry is often characterized as being conservative and slow to change or adopt new quality practices.[6] That is why FMEA is a good quality tool for this industry. It is relatively easy to understand and implement, and the groundwork has already been done in many instances with HACCP planning.
FMEA developed alongside HACCP at NASA in the 1960s. It was adopted by the automotive industry in the 1980s and ’90s and is now being used in other sectors such as healthcare.[7] A risk analysis process involves acquiring information, model-ing, analyzing the information and the model and coming to a decision that improves the product.[8]
Navigating the Process
To get more insight into possible failures, a cross-functional team is routinely used. The team breaks down the process into fundamental components to detect all potential failures at each component.[9] The actual FMEA of a system is then typically developed with a form that outlines each part of the process. A typical form will identify the following:
• The process part or stage
• The potential failure
• The effects of the potential failure
• The severity of the failure effects
• Potential causes of the failure
• The frequency of occurrence
• Detectability of the failure
• The risk priority number (RPN)
A numerical value is then assigned to the severity of the failure (S), the frequency of occurrence (O) and the detectability of the failure (D). These numbers are multiplied to give the RPN. The RPN is an index that gives the relative quality risk associated with each failure mode.[10]
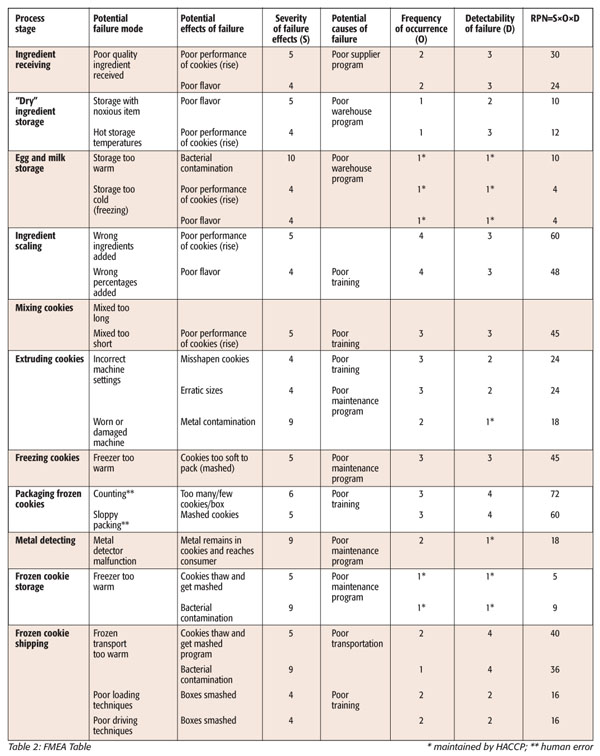
With the FMEA table completed (see Table 2), steps in the process that present the greatest challenges to cookie quality can be identified by comparing their relative RPNs. The steps with the highest numbers are the biggest risk to quality. A cross-functional team can then decide at what level they will consider an RPN acceptable. In this example, the cutoff number that will be used for the cookie process will be 45. A potential failure with a number greater than this is deemed unacceptable and that step in the process must be improved. A good way to visualize these relative risks is with a Pareto diagram, the chart created by economist Vilfredo Pareto. This diagram is a simple, easy-to-use method of visually representing which problems are the most vital to quality.[11] A Pareto diagram of quality risks in the frozen cookie production process will point out which problems should be addressed first to improve the quality of the cookies (Figure 2).
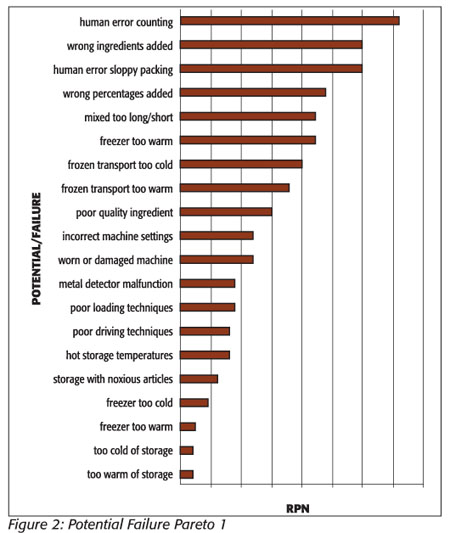
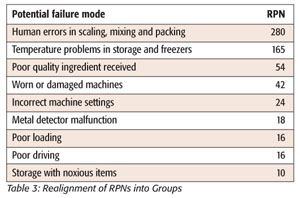
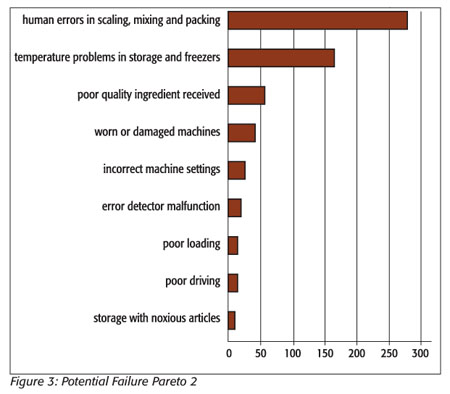
Unfortunately, this Pareto diagram generated from the risk assessment table does not give a useful differentiation of the “vital few” problems that need to be addressed in the cookie process. The relative closeness of the frequencies of the problems as charted makes the diagram less useful than it could be. A methodology described by Ronen et al.[12] and later expanded upon by Grosfeld-Nir et al.[13] proposes that classifying problems by symptoms rather than specific areas of a process will generate a much more useful Pareto diagram in this situation. Certain problems recur at different points in the process and are more representative of the problems or symptoms that need to be addressed. If we rearrange the first risk assessment using causes of recurring symptoms, such as temperature problems in freezing and storage, and combine their RPN numbers, we get a chart with a much clearer definition of the “vital few” problems and a more definitive Pareto diagram (Table 3 and Figure 3). Temperature control and human error now stand out as the “vital few” that are causing most of the defects.
By addressing the problems highlighted by the new Pareto diagram, we will not only be addressing the items that were over 45 in the first risk assessment, we will also be lowering many of the other scores as well. The four failure modes that exceed the cutoff point in the cookie process are: human error in counting, wrong ingredients added, sloppy packing (i.e., the placing of sheets of frozen cookies in the case haphazardly, causing breakage) and wrong percentages of ingredients added. The focus of the group on reduction of human error should bring these areas into acceptable RPN range by decreasing the occurrence or severity of the failures, or by increasing the likelihood of detection of the failure.
Since excellence in quality comes from improvements to the system that will reduce defects rather than detecting errors after they have already occurred, the team should focus their efforts on decreasing the occurrence of quality failures, or decreasing their severity.[14]
To accomplish this reduction, the cause of the failures must be identified. Root-cause analysis will allow the team to drill down to the why the problem occurs, not just the what or how it occurs,[15] usually completed via the Ishikawa, or fish bone, diagram (Figure 4), which is a qualitative tool that determines the root causes of the problem being examined[16] and begins as an arrow with the problem written at its tip. Branches are drawn from this tip to outline the primary causes for the problem. Then secondary causes are drawn as branches from these primary causes. This branching continues until you arrive at a root cause of the problem. The first problem the team will analyze will be the one that was identified as the leading cause of quality failures in the Pareto diagram, in this case, human error in the production process that causes defects.
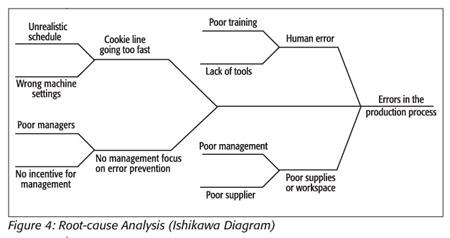
After this analysis, the root causes of the errors are found to be the following:
• Poor supplies procurement/supplier
• Poor management in production
• Poor scheduling or wrong machine settings
• Poor employee training and lack of tools
The implementation of the FMEA tools beyond the existing HACCP program has improved the quality of the frozen cookies in both areas: food safety and consumer satisfaction with appearance and taste.
What Does It All Mean?
The synergy of the combination of FMEA and HACCP provides a powerful means to improve quality in the frozen cookie manufacturing process. It can now be used as a tool for continuous quality improvement. Once all quality problems are brought under control to where they have an acceptable RPN, the threshold at which an RPN is considered acceptable can be lowered. The process of root-cause analysis can once again be used to lower the numbers to an acceptable range. This cycle can be repeated for continuing improvement toward product excellence.
The model shown in Figure 5 shows how, using principles from both analysis techniques, FMEA and HACCP, a hybrid analysis and control program can be implemented.
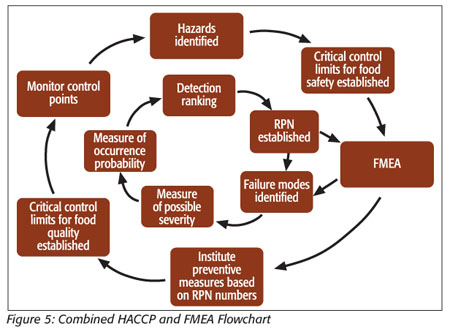
This circular flowchart provides a guideline for the steps in implementing the combined food safety and quality program. After first establishing what food safety hazards exist, and setting critical controls for these hazards, an FMEA is performed to establish RPNs for these hazards. These RPNs will serve as guides to finding the root causes of the hazards and implementing preventative measures. This is an improvement over current HACCP practices because this process will not just control or detect hazards, it will help to identify and eliminate the causes of hazards. When these causes are identified, they may be eliminated through better process and product control.
For our cookie team, the process of improving the product based upon the HACCP-FMEA model will begin with a management and employee training program on the importance of avoiding errors in production and how this can affect profit. There can also be training on specific functions, such as packing or mixing to further develop employee skills. The employees will also be given tools to help avoid errors. An example of this would be placing a paper sheet between every three layers when counting cookies into the cases. There will be a formal program instituted covering the procurement of supplies that will ensure that quality supplies are always ordered and delivered, and the schedule will be adjusted to reflect the true capacity of the production employees. As an example of the improvements made after these measures are all in place, a new assessment is made and the severity score for the amount of cookies over or undercounted into a case is now found to be 4 and the frequency-of-occurrence score is now 2. These improved numbers now give the counting errors while packaging cookies an RPN of 32, which is in the acceptable range. This root-cause analysis process is repeated for the temperature problems that are causing many instances, or symptoms, of poor quality throughout the process. The underlying causes of temperature problems are found to be the following:
• Maintenance personnel are not trained in refrigeration
• The maintenance department does not have the specialized tools needed for work with freezers and coolers
• Management does not take a strong enough interest in the maintenance of the refrigeration systems (i.e., budgeting for maintenance, training and unit replacement)
As a result of the identification of these problems, the group decides to contract with an outside firm that will manage the maintenance and repair of the refrigeration systems. This firm is also willing to install remote monitoring sensors in the refrigeration units that will alert them to problems with the systems. This worked very well for the cookie producing plant and their freezers and coolers are performing significantly better. Because of this, the RPNs for many different problems associated with temperature problems such as “ingredient storage too warm” and “cookies not frozen” are cut almost in half. One particular symptom that was evident in many parts of the process, the cookies deforming or “mashing” because they were not frozen, has been practically eliminated.
Additional Uses for HACCP-FMEA
The knowledge gained through the integrated HACCP-FMEA process can then be applied to other products and processes to improve their design. This will build understanding of the CCP methodology, which can be applied to quality risks in the process, allowing the principle of using CCPs to ensure that the safety of the product is continuously under control. CCP methodology can then be applied to the quality components of the cookie line that were enhanced with the FMEA program. These CCPs prevent the gains made with FMEA from being lost to complacency over time. Quality CCPs can be established within employee training and the refrigeration maintenance programs, and new programs put in place as a result of the integrated HACCP-FMEA can be thoroughly documented and critical limits, such as temperature fluctuations in the freezers, instituted. The combination of the analysis techniques of FMEA and the control point methodology of HACCP helps create a system where the quality, and safety, of the product is being monitored and ensured by CCPs. One CCP, the temperature-monitoring program, serves as a control for both cookie quality and food safety. Thus, the institution of an ongoing continuous improvement effort that integrates FMEA and HACCP can help foodservice employees pinpoint and control for an ever-narrowing set of parameters, thus continuously controlling and improving quality and safety simultaneously.
Steven Atkins, M.B.A., works in both quality assurance and quality control with a major U.S. food manufacturer. He received his M.B.A. from Metropolitan State University in Minneapolis, MN. He can be contacted at stevenatkins@comcast.net.
Marcia Hagen, Ph.D., is an assistant professor at Metropolitan State University. Her research interests include organizational behavior and quality management. She can be reached at marcia.hagen@metrostate.edu.
Looking for quick answers on food safety topics?
Try Ask FSM, our new smart AI search tool.
Ask FSM →


.webp?t=1721343192 "9781032369990 (1).webp")
