How To Develop a Sampling Plan
Sampling can be used to sample a process during operation or to sample the output of a process, such as a product lot

Sampling can be a confusing process. One reason is that many of the words used to describe sampling may have different meanings, or several words may describe the same concept. This article uses a single meaning for each word. If several words describe the same concept, then the second word will be included in parentheses.
Sampling is part of a process that has two functions. It can be used to sample a process during operation or to sample the output of a process, such as a product lot. During sampling, the measurand (the object being measured) must be properly selected and properly transported to a location where the object or objects will be analyzed, and the results must be reported to the appropriate individuals. This article covers the systematic development of a sampling plan.
Setting the Stage
Imagine that a scientist goes to a statistician and says, "This project is important; therefore, I want to use statistical sampling to measure for a pathogen in a lot. What is the correct sample size?" The statistician may do the following: ask clarification questions, conduct some calculations, and then respond with a recommended sample size. The scientist may then respond that the number of samples is too large. On a rare occasion, the number of samples may be deemed too small, which would then lead the scientist to ask if the sample size will still be adequate. Unfortunately, most of the time the conversation does not eventually lead to the correct statistical sampling process. Furthermore, only one part of the sampling process has been addressed.
This example does not address critical factors. First, we do not have knowledge of the actual conversation between the statistician and the scientist. Does the scientist want to evaluate a measurand of specific product lot, or does the scientist want to evaluate the output of a process over time? Are the data being evaluated measurements (variable data) or counts (attribute data)? We must make a few assumptions about the example. The measurand the scientist wants to evaluate is Escherichia coli O157:H7. The individual wants to determine if the pathogen is present in the product lot. Thus, the scientist should use an acceptance sampling procedure that will compare the test results to a specific criterion—the presence or absence of the pathogen in the test results. If one of the samples tests positive for the pathogen, then the scientist will conclude that the product lot is contaminated with E. coli O157:H7. If none of the samples test positive for the pathogen, then the scientist will conclude that the product lot is not contaminated with E. coli O157:H7.
In addition, to properly evaluate the test results and report them, the scientist must understand the context that was used to collect and analyze the samples. The start of this evaluation process is to develop a sampling plan.
Sampling Plan Basics
Dr. W. E. Deming1 defined two types of statistical studies: enumerative studies and analytic studies. Different statistical methods are used for each type of study.
Enumerative studies are designed to explain, evaluate, or describe the conditions of an existing population. An example of an enumerative study could include defining the conditions of a specific product lot and comparing the test results to a criterion. Enumerative studies also can be used to provide a snapshot of measurements of a product over a specific time frame. In both cases, the population or the number of product lot(s) can be determined and is fixed.
Looking for quick answers on food safety topics?
Try Ask FSM, our new smart AI search tool.
Ask FSM →
In contrast, analytic studies focus on processes that can change over the period of time. Thus, the population in analytic studies is not constant and will change over the time period. One important use of the analytic study is to determine if sources of variation are changing. This is determined by evaluating the test results for either positive or negative trends. In addition, analytic studies are designed to predict the results in the future, if the process is stable. This occurs when the sources of variation are stable. Thus, process control charts are a critical tool in conducting an analytic study.
In the example above, the scientist and the statistician should develop a sampling plan based on an enumerative study. Next, the team needs to determine the type of samples that will be collected and how the data will be analyzed. One critical decision is the following: will the data be continuous data or measurement data, or will the data be attribute data or count data?
Continuous data (or quantitative data) are measurement data. With measurement data, it may be possible to change the test method to increase the precision of the test results. Statistics used to report continuous data as generally the mean and standard deviation. (Note: The mean gives an estimate of the central tendency of a population. The standard deviation gives an estimate of the size of the variation of a population. Care must be used when evaluating the standard deviation. It is estimated that the mean ± one standard deviation will estimate the range that encompasses 67 percent of the values, the mean ±2 standard deviations will estimate the range that encompasses 95 percent of the values, and the mean ±3 standard deviations will estimate the range that encompasses 99 percent of the values.) A general rule of thumb is that the measurement process should be selected so that the standard deviation of the measurement processes is one-tenth of the standard deviation of the object being measured.
Attribute data (or qualitative data) are count data. Typically, when attribute data are compared to specifications, the counts can be characterized as either nonconforming units or nonconformities. A nonconforming unit occurs when a unit does not meet one or more specifications, thus making the entire unit unacceptable. It should be noted that every incidence of a unit not meeting a specification is a nonconformity; however, just because a unit has a nonconformity does not make the unit a nonconforming unit. For example, consider a display of fresh corn in a grocery store. If one cob of corn has a slightly dried leaf, then this cob of corn contains a nonconformity; however, if the same cob of corn tastes acceptable when properly prepared, then it would not be classified as a nonconforming unit. If a box of pasta has a rip in the package, then the box of pasta would have both a nonconformity (the cut package) and it would be considered a nonconforming unit (the box would not be acceptable to a customer). In addition, the integrity of the box is compromised, so it cannot properly protect the dried pasta from environmental contamination.
Typically, it is more desirable to use a variable measurement system than an attribute measurement system. The number of samples that need to be collected and analyzed is smaller when comparing the variable measurement system to an attribute measurement system.
A sample size needs to be selected. A number of references define sample size for either variable data sampling and/or attribute data sampling and include ANSI/ASQ Z1.4-2003,2 ANSI/ASQ Z1.9-2003,3 ICMSF Volume 8,4 Zero Acceptance Number,5 and General Guidelines for Sampling.6 Unfortunately, individuals with limited statistical knowledge can select a sampling size and not understand the potential risks associated with a specific sampling plan.
Consider a scientist who needs to develop a sampling plan. The sample size is being selected for a product lot (or the population) that contains a number of units. The lot are packages of ground beef. The ground beef is being tested for the presence or absence of a pathogen such as E. coli O157:H7. If pathogenic E. coli is found in the product, then the entire lot will be rejected for a specific use and diverted to a product where the ground beef will be fully cooked prior to adding to the product. The scientist selects the n = 60, c = 0 sampling plan described in ICMF Volume 8.4 (Note: An n = 60, c = 0 attribute sampling plan means that for a population or a product lot of any size, 60 samples will be randomly taken from the lot and will be analyzed for the pathogen. If none of the samples test positive for the pathogen, then the lot will be accepted. If one or more of the samples tests positive for E. coli O157:H7, then the entire lot will be rejected. If the lot fails the test, then the entire lot will be diverted for an appropriate alternative use.)
ICMF Volume 84 reports that there are 15 sampling plans. The plan to be selected is based on two independent criteria:
- Concerning utility and public health, five categories ranging from “utility” to “severe hazard”
- Considering conditions under which the food is expected to be consumed after sampling and during the normal course of events, three categories ranging from “reduced risk” to “may increase risk.”
The sampling plan n = 60, c = 0 is the strictest sampling plan.
Figure 1 presents an operational characteristic (OC) curve for this sampling plan. Note: In Figure 1, the X-axis is the fraction of nonconforming and not the percentage of nonconforming.
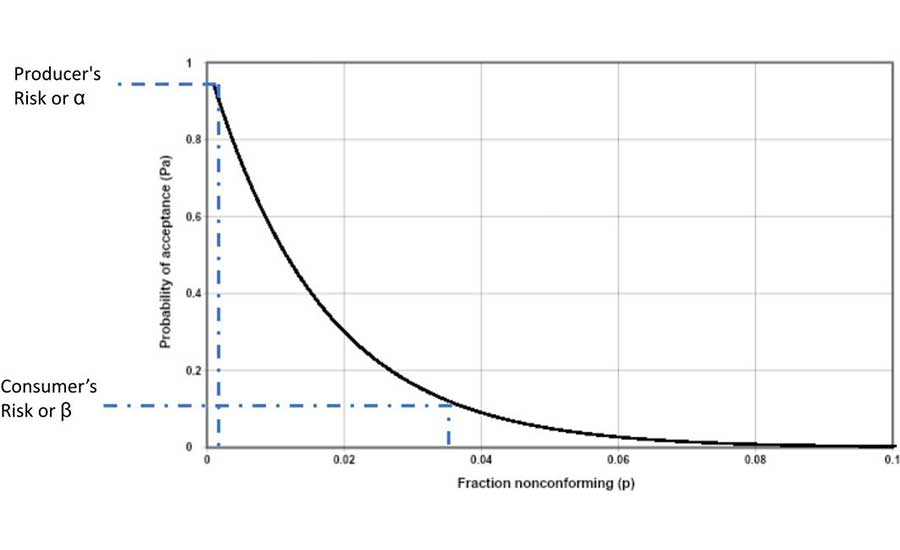
First, if the sampling plan was properly conducted and the samples were properly analyzed, and none of the tests returned a positive for the pathogen, then this would not statistically indicate that the lot was pathogen free. Statistical analysis indicates that there could be a chance that the lot could contain the pathogen. The OC curve (Figure 1), a line that is plotted, shows the relationship between the probability of accepting the lot and the fraction of nonconforming units that could be in the lot. The producer's risk, or α, is the probability of rejecting a "good" lot, or in this case, declaring that the lot that does not contain the pathogen." The consumer's risk, or β, is the probability of accepting a "bad" lot, or in this case, a lot that may contain the pathogen.
With an n = 60, c = 0 sampling plan, the probability of rejecting a "good" lot (the producer's risk) is typically set at 95 percent probability of acceptance. If none of the samples test positive for the pathogen, then there is an estimate that a maximum of 0.1 percent of the units in the lot may contain a unit that has a pathogen (nonconforming units). The probability of accepting a "bad" lot (the consumer's risk) is typically set at 10 percent of acceptance. If none of the samples test positive for the pathogen, then there is an estimate that a minimum of 3.7 percent of the units in the lot may contain the pathogen.
It should be noted that when attribute sampling is used, it is not possible to have a perfect OC curve. A "perfect" curve would occur when the producer's risk equals the consumer's risk.
The attribute sampling plan assumes that the pathogens are evenly distributed throughout the entire lot. This means that there are no "hot spots" in the lot or spots where the pathogen can concentrate.
The Sampling Plan
The sampling plan includes all of the steps that need to take place to collect the samples, collect appropriate context information with regard to the samples, and transport the samples to the location where they will be analyzed. This article does not describe the steps needed to analyze and report the results from the analysis.
The sampling plan should be supported by one or more procedures describing the following:
- Sampling order (typically, samples for biological analysis samples are collected, followed by samples for physical analysis, and then samples for chemical analysis)
- Methods used to describe the collection of samples, including tools and equipment
- Processes to prevent contamination during sampling and to prevent cross-contamination of the sample
- Processes to prevent deterioration of the sample
- Methods used to transport the samples to the test location (or shipping location, if an offsite test facility is used).
Ancillary information that is used to define the context in which the samples have been collected include, as applicable:
- Sample time and date
- Sample temperature
- Sample number, especially when multiple samples are collected
- Lot number and lot size
- Run number
- Sample location, which can include process equipment and line number, as well as warehouse location
- Sample type and any other useful sample description
- Sample time, date, and temperature when delivered to the test site or to the location where the samples will be shipped.
Once the audit plan is developed, the scientist can implement the sampling plan and take the first step in properly conducting a statistical sampling protocol.
Takeaway
Sampling plans are valuable tools for collecting samples and understanding quality and food safety data. If an individual does not understand the principles of how to develop a sampling plan, it is recommended that they seek appropriate help to properly develop a sampling plan. This help will assure that the appropriate number of samples are collected and analyzed. In addition, reliable results are used to evaluate the status of processes.
Further help should be obtained when the measurand, typically a pathogen, can be concentrated in a small location of the lot or in a "hot spot." When this happens, a special sampling process needs to be developed.
References
- Deming, W.E. "Enumerative and Analytic Studies." Deming.org. May 29, 2013. https://deming.org/enumerative-and-analytic-studies/
- American Society for Quality (ASQ). "ASQ ANSI/ASQ Z1.4-2003: Sampling Procedures and Tables for Inspection by Attributes." Milwaukee: ASQ Press, 2003.
- ASQ. "ASQ ANSI/ASQ Z1.9-200: Sampling Procedures and Tables for Inspection by Variables for Percent Nonconforming." Milwaukee: ASQ Press, 2003.
- International Commission of the Microbiological Specifications for Foods (ICMSF). Microorganisms in Foods. "Volume 8: Use of Data for Assessing Process Control and Product Acceptance." New York: Springer, 2011.
- ASQ. "Zero Acceptance Number." 5th Ed. Nicholas L. Squeglia. Milwaukee: ASQ Press, 2008.
- Codex Alimentarius Commission (CAC). "CAC/GL 50-2004: General Guidelines on Sampling." Geneva: 2004.
John G. Surak, Ph.D., is the Principal of John Surak and Associates, a consulting company focused on food safety and quality management systems. He is also a member of the Editorial Advisory Board of Food Safety Magazine.


