Food Safety Testing Continues to Increase
Processors plan more testing—but only some analytical methods show growth
Welcome to part two of our survey of 200 processors in the U.S., Canada, and around the world about their current microbiology sample collection and analysis practices and plans for the near future. In part one, we heard from processors that their testing and test volumes—especially environmental monitoring—will continue to grow at a rapid pace, with processors in the sample saying that their test volumes will increase outnumbering those reporting a decrease by a ratio of 5:1.
We had also discussed in part one that much of this new volume will be outsourced to commercial labs. But will the types of tests change? Will processors use the same methods for this new test volume? Or will one or more methods show above-market growth?
Processors conduct microbiology samples in two major categories—tests for nonpathogenic indicator organisms and tests for pathogens.
Let’s start with what we heard about tests for indicator organisms: 94 percent of samples were analyzed using culture methods with growth media. This is not surprising as these methods are accurate, easy to run, and do not require a highly sophisticated lab infrastructure for analysis. This result also agrees with data that we have for analytical methodology use worldwide, where we see growth media methods used for indicator organisms for more than 80 percent of samples.
The growth media used generally fall into one of two categories: 1) traditional dry powdered media (dehydrated culture media) that the user prepares themselves in their own lab (or “media kitchen”) and 2) prepared or “convenience” media, ready-to-use growth media sold with no further preparation needed by the user, such as film plates, preprepared plated media in dishes, dip slides, contact plates, swabs, and other ready-to-use test formats.
In this survey, 54 percent of samples were analyzed using media prepared in-plant and 40 percent using convenience media tests (Figure 1).
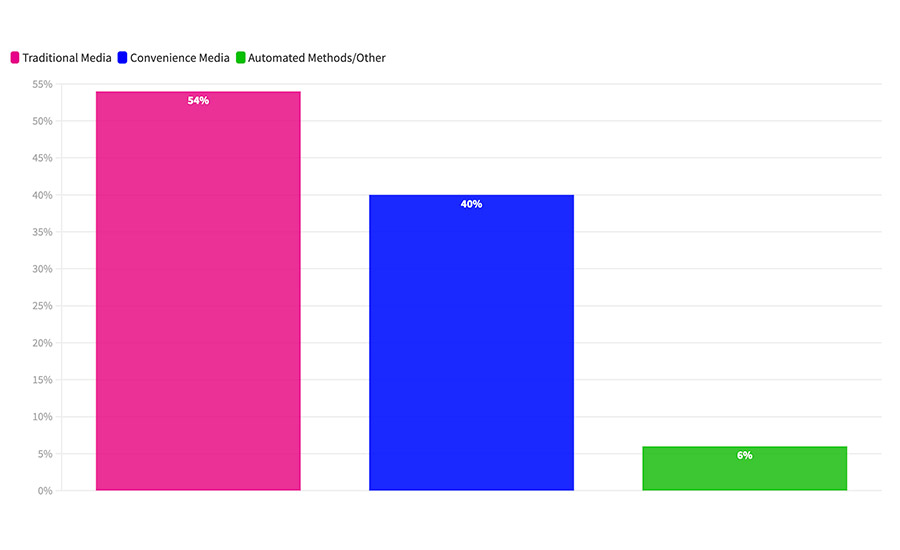
FIGURE 1 What method do you use to analyze your indicator organism samples?
Credit: Bob Ferguson
Whether a processor prepares their own media from dehydrated culture media or buys products in a preprepared format depends on several factors. First, we find that the use varies greatly by geography. In this survey, 60 percent of the processors in the U.S. and Canada report using preprepared convenience media, while fewer than 40 percent report preparing their own in an in-house media kitchen.
Looking for quick answers on food safety topics?
Try Ask FSM, our new smart AI search tool.
Ask FSM →
Some of these differences can be explained by the labor practices that we discussed in part one of this report. Processors in the U.S. and Canada tend to use labor-saving methods due to their very lean operations. Processors in Europe and elsewhere in the world, on the other hand, find it more difficult to reduce head count, and thus maintaining a media preparation kitchen makes more sense.
Cost is an additional factor. Because of the related labor savings, processors in the U.S. and Canada are less sensitive to the price differences between the formats. Processors in regions other than North America tend to report that preprepared convenience media is “expensive,” and they see cost advantages in preparing their own media.
Dry media is also easier to store and has a longer shelf life. In this survey sample, we had many respondents from smaller countries and island nations. In comments we heard, processors in this situation say they need to guard against supply chain issues and shipping delays that can result in shortages; using shorter-shelf-life materials can exacerbate these problems. Dry media with its longer shelf life is more convenient to store and allows for better supply security. As such, in this sample, nearly 80 percent of the international processors (outside of North America and Europe) reported using traditional growth media that they prepare on their own.
For pathogen samples, we saw a fairly typical distribution of analytical methods, with one major exception: We saw a far larger share of samples analyzed using polymerase chain reaction (PCR) than expected. In North America, for example, in survey data that we’ve analyzed previously, the sample-weighted average for the use of PCR was approximately 40 percent. Yet in this survey, processors reported using PCR for 53% of samples (Figure 2). We also saw this same phenomenon in what was reported by the international processors in this survey, where previously we would have expected to see fewer than 10 percent of samples analyzed by PCR. In this survey, they reported using PCR for close to 20 percent of their sample volume.
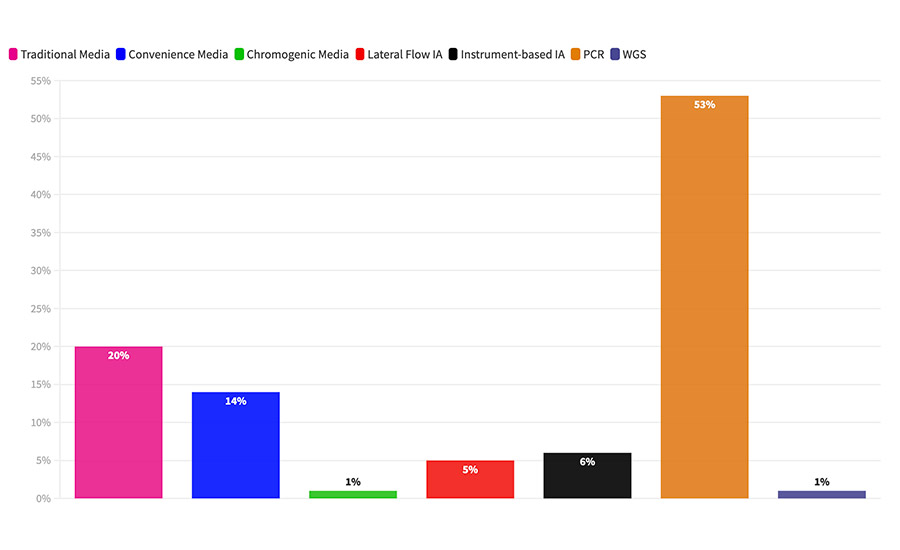 FIGURE 2 What method do you use to analyze your pathogen samples?
Credit: Bob Ferguson
Some of this can be attributed to the organic, above-market growth of PCR over the past few years. Some of this may also be attributable to the distribution of this survey population, which included a high number of individuals at large, multinational plant sites and fewer individuals from sites in Asia than we would consider representative of the worldwide market.
But potentially more important than those two factors is that a large percentage of the companies reporting their use of PCR also reported that they were outsourcing their samples to a commercial lab. Also, many of these companies had larger-than-average weekly pathogen test volumes (and at the higher end of the range of sample volumes in this survey population).
Until a few years ago, companies with these larger volumes of pathogen samples would have maintained their in-plant lab to take advantage of the lower costs of in-plant analyses. That is, with a sufficient volume of tests, the economic advantages can outweigh the disadvantages of in-plant analyses. In this survey population, however, the indication is that pathogen samples are outsourced at an ever-growing rate, and even those processors with high test volumes are looking to avoid in-plant pathogen analyses regardless of the increase in cost. And when they do outsource testing, PCR is more frequently selected as the analytical method used than it was when the samples were analyzed in-plant.
This conversion from in-plant to outsourcing makes sense. PCR requires relatively expensive instrumentation and technical expertise to analyze samples properly. Every commercial lab will have a level of analyst capabilities and infrastructure that allows them to use PCR—and probably multiple formats of PCR—as well as numerous other analytical test formats. Some plant labs may have used PCR in the past, while others may have relied on other methods (culture-based, immunoassay, etc.).
What we are seeing here may be a strong indication that the ongoing outsourcing to commercial labs is also driving the conversion to PCR faster than we would have expected to see without this growth in outsourcing.
Most processors report that when they outsource to a commercial lab, they specify the analysis that will be used. Plant labs that had been using PCR and are now outsourcing their samples report that they are still specifying the use of PCR to their contract laboratory. This allows them to maintain data consistency for their customer and regulatory reporting requirements.
For other processors who had not traditionally used PCR, when choosing to outsource, they seem to be switching to PCR. It is reasonable to assume that their new commercial lab partners have a strong hand in driving this conversion. Processors will look to their lab partners for advice on the best analytical methods to use, and labs have a strong incentive to drive volume through their labor-efficient, automated, and higher-margin PCR platforms. This is not to suggest there is anything but the best intentions behind the labs’ steering their clients to PCR. PCR is a very good technology that is highly effective in analyzing pathogens for food safety applications. This performance, of course, makes it easier to specify and justify the use of PCR. This trend, if it plays out generally in the way we are seeing in this survey, may accelerate the already above-average growth in the use of PCR. This is something we will be watching closely in the coming years.
Finally, one area where we did not see any change in historic data was in the use of whole-genome sequencing (WGS). For the fifth year in a row, very few processors report using WGS for any of their samples. In this survey, only 2 percent of the respondents reported using WGS even once (Figure 3).
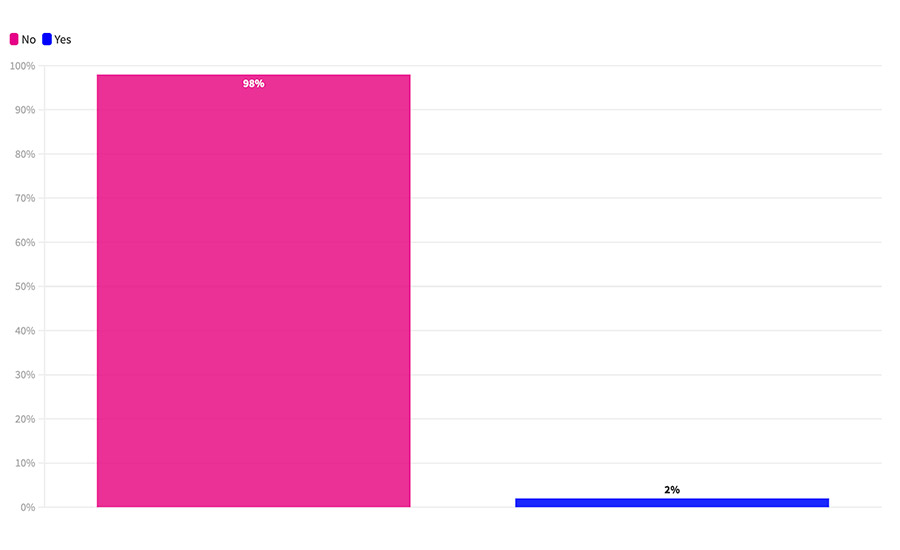 FIGURE 3 Have you used whole-genome sequencing?
Credit: Bob Ferguson
Outside the U.S. and Canada, only one processor mentioned using WGS even once and then only for a single instance when certification validation was needed. In the U.S. and Canada, only two processors mentioned having used WGS; both mentioned that they had used it only on a few isolated occasions but never for regular use.
Most respondents mentioned “not having a need” or “We have not seen the necessity to use WGS” or a similar response. The other common answers we hear are “WGS is too complicated for any use that we need,” “We have a low incidence of positive samples, and we have no need for further sophisticated confirmation,” or “WGS is too expensive.”
Food Safety Insights will continue to track these and other important trends in the food safety marketplace.
Bob Ferguson is president of Strategic Consulting Inc. and can be reached at bobferguson9806@gmail.com or on Twitter at @SCI_Ferguson.


